TV ratings provide a broad overview of viewership based on sampled audiences, offering insights into peak watching times and demographic segments for traditional broadcasts. Streaming analytics, on the other hand, deliver granular data including real-time viewer behavior, engagement metrics, and personalized content consumption patterns. Combining TV ratings with streaming analytics enables entertainment pet brands to tailor marketing strategies, optimize content delivery, and enhance audience targeting across multiple platforms.
Table of Comparison
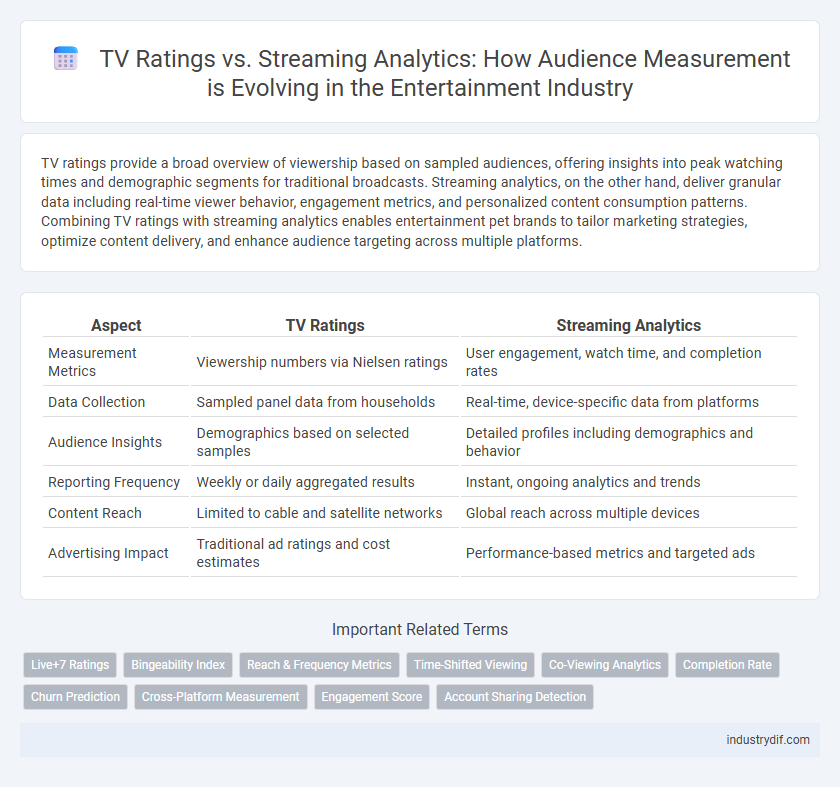
| Aspect | TV Ratings | Streaming Analytics |
|---|---|---|
| Measurement Metrics | Viewership numbers via Nielsen ratings | User engagement, watch time, and completion rates |
| Data Collection | Sampled panel data from households | Real-time, device-specific data from platforms |
| Audience Insights | Demographics based on selected samples | Detailed profiles including demographics and behavior |
| Reporting Frequency | Weekly or daily aggregated results | Instant, ongoing analytics and trends |
| Content Reach | Limited to cable and satellite networks | Global reach across multiple devices |
| Advertising Impact | Traditional ad ratings and cost estimates | Performance-based metrics and targeted ads |
Understanding Traditional TV Ratings
Traditional TV ratings measure audience size through Nielsen's sample households, providing key data on viewer demographics and engagement. These ratings inform advertising strategies and programming decisions by quantifying live viewership during scheduled broadcasts. Unlike streaming analytics, TV ratings rely on fixed sample panels rather than real-time individual user data, limiting granularity but offering established benchmarks for industry comparison.
Introduction to Streaming Analytics
Streaming analytics revolutionizes entertainment by providing real-time insights into viewer behavior, unlike traditional TV ratings that rely on sample-based data. Platforms can track engagement metrics such as watch time, pause frequency, and content preferences to tailor recommendations and optimize programming. This granular data helps content creators and advertisers make informed decisions, maximizing audience retention and monetization opportunities.
Key Metrics in TV Ratings
TV ratings primarily rely on Nielsen data measuring live viewership and demographics, focusing on metrics such as average audience size, rating points, and share percentage. Key metrics include Gross Rating Points (GRPs), which quantify total exposure, and Average Minute Audience (AMA), indicating consistent viewer engagement minute-by-minute. These metrics enable broadcasters and advertisers to assess program popularity and target audience reach in traditional television markets.
Core Data Points in Streaming Analytics
Streaming analytics prioritize core data points such as viewer engagement metrics, including average watch time, completion rates, and session frequency, which offer deeper insights than traditional TV ratings focused primarily on total viewership and demographic estimates. These granular data enable precise content performance evaluation and personalized recommendations, driving user retention and targeted advertising strategies. Unlike TV ratings, streaming analytics also track real-time audience behavior across devices, providing a dynamic understanding of consumption patterns.
Measurement Methodologies: TV vs Streaming
TV ratings rely on panel-based sample data using Nielsen's People Meter technology to estimate viewership, providing broad demographic insights but limited granular engagement metrics. Streaming analytics utilize real-time, server-side tracking of individual user behavior across devices, enabling precise measurement of watch time, viewer interactions, and content completion rates. This contrast highlights traditional TV's dependence on statistical inference versus streaming's data-driven accuracy and audience segmentation capabilities.
Accuracy and Limitations of Each Approach
TV ratings rely on sample-based data collection methods that can provide broad audience insights but often lack granular viewer behavior details, leading to potential accuracy limitations. Streaming analytics utilize direct user data, offering precise, real-time measurements of viewer engagement and content consumption patterns, though they may not capture offline or shared-viewing metrics effectively. Both approaches face challenges: TV ratings struggle with demographic representation and time-shifted viewing, while streaming analytics contend with platform fragmentation and privacy constraints limiting comprehensive data access.
Impact on Advertising Strategies
TV ratings provide broad demographic insights and real-time audience measurement, enabling advertisers to target traditional viewers effectively during peak viewing hours. Streaming analytics offer granular data, including viewer behavior, content preferences, and engagement patterns, allowing brands to tailor ads for personalized experiences and optimize campaigns across multiple devices. Combining TV ratings with streaming metrics empowers advertisers to refine budget allocation, improve ad relevance, and maximize reach in a fragmented media landscape.
Audience Demographics: Linear vs Digital
Linear TV ratings traditionally provide comprehensive audience demographics segmented by age, gender, and region, offering broadcasters critical insights into viewer preferences during scheduled programming. Streaming analytics capture nuanced user behavior, including real-time engagement, binge-watching patterns, and cross-device usage, enabling precise targeting of younger, tech-savvy demographics often underrepresented in linear metrics. The contrast highlights how streaming platforms leverage granular data to tailor content and advertising strategies, while linear TV relies on established demographic models to maintain broad appeal.
Industry Trends Shaping Viewing Measurement
TV ratings continue to provide standardized metrics for live broadcast audiences, but streaming analytics offer real-time insights into on-demand viewing patterns, enabling more precise audience segmentation. The rise of hybrid measurement models combines traditional Nielsen ratings with digital streaming data to capture comprehensive audience behavior across platforms. Emerging trends emphasize the integration of cross-device tracking and AI-driven predictive analytics to shape content distribution strategies and advertising effectiveness in the evolving entertainment landscape.
The Future of Audience Analytics in Entertainment
TV ratings have traditionally measured audience size using Nielsen data, whereas streaming analytics leverage real-time metrics such as viewer engagement, watch time, and demographic segmentation. The future of audience analytics in entertainment hinges on integrating AI-driven insights and cross-platform data to capture comprehensive consumer behavior. Enhanced predictive models and personalized content recommendations will drive strategic decisions in content creation and distribution.
Related Important Terms
Live+7 Ratings
Live+7 ratings capture traditional TV viewership within seven days of broadcast, offering a comprehensive measure of audience engagement compared to same-day ratings. Streaming analytics track on-demand consumption data beyond the initial air date, providing deeper insights into long-tail viewership patterns and audience retention over time.
Bingeability Index
The Bingeability Index measures viewer engagement by quantifying the number of consecutive episodes streamed within a specific timeframe, providing deeper insights than traditional TV ratings into audience behavior. Streaming analytics use this index to optimize content release strategies and predict show longevity based on real-time consumption patterns.
Reach & Frequency Metrics
TV ratings measure audience reach and frequency through the average number of viewers per program, providing standardized data across demographics, while streaming analytics deliver granular insights on user engagement, including exact watch time, unique viewers, and repeat viewing patterns. Combining these metrics enables content creators and advertisers to optimize audience targeting by understanding both broad reach through TV and personalized consumption via streaming platforms.
Time-Shifted Viewing
Time-shifted viewing significantly impacts TV ratings by capturing audiences who watch content outside traditional broadcast schedules, leading to a decline in live viewership metrics. Streaming analytics provide detailed insights into on-demand consumption patterns, measuring viewer engagement, playback behaviors, and completion rates that traditional TV ratings fail to capture.
Co-Viewing Analytics
TV ratings primarily measure audience size through traditional Nielsen metrics, while streaming analytics provide granular co-viewing insights by tracking simultaneous account usage and device interactions. Advanced co-viewing analytics enable entertainment companies to understand viewer demographics, engagement patterns, and content preferences in real time, surpassing the limitations of conventional TV ratings systems.
Completion Rate
Completion rate serves as a critical metric in both TV ratings and streaming analytics, measuring the percentage of viewers who watch a program from start to finish. Streaming platforms leverage completion rate data to optimize content recommendations and advertising strategies, while traditional TV ratings rely on broader audience estimates that may overlook viewer engagement nuances.
Churn Prediction
TV ratings provide aggregate viewership metrics crucial for understanding broad audience trends, while streaming analytics capture detailed user behavior enabling precise churn prediction through machine learning models that analyze watch time, engagement patterns, and content preferences. Integrating traditional Nielsen ratings with real-time streaming data enhances predictive accuracy, allowing entertainment companies to proactively tailor retention strategies and reduce subscriber turnover.
Cross-Platform Measurement
Cross-platform measurement integrates TV ratings with streaming analytics to provide a unified view of audience engagement across traditional broadcasts and digital platforms. This approach leverages data from Nielsen ratings and streaming services like Netflix and Hulu, enabling advertisers to optimize campaigns based on comprehensive viewership metrics and behaviors.
Engagement Score
Engagement Score in TV ratings quantifies viewer retention and real-time interaction, providing broadcasters with a clear metric of audience loyalty, while streaming analytics leverage granular user data such as watch time, click-through rates, and content completion to deliver a more precise measurement of viewer engagement. This data-driven approach in streaming platforms enables content creators to optimize programming and advertising strategies based on detailed behavioral insights rather than aggregate viewership numbers.
Account Sharing Detection
TV ratings rely on sample-based audience measurement techniques, whereas streaming analytics utilize comprehensive account-level data to detect account sharing through simultaneous device usage patterns and IP address discrepancies. Advanced algorithms analyze behavioral inconsistencies and viewing overlaps to accurately identify multiple users within a single subscription, enabling platforms to optimize content recommendations and revenue models effectively.
TV Ratings vs Streaming Analytics Infographic