Foot traffic analysis measures the number of visitors entering a retail store, providing insights into overall customer volume and peak shopping times. Heatmap analytics go deeper by visualizing customer movement patterns and dwell times, identifying high-interest zones and bottlenecks within the store layout. Combining these tools enables retailers to optimize store design, enhance customer experience, and improve sales strategies.
Table of Comparison
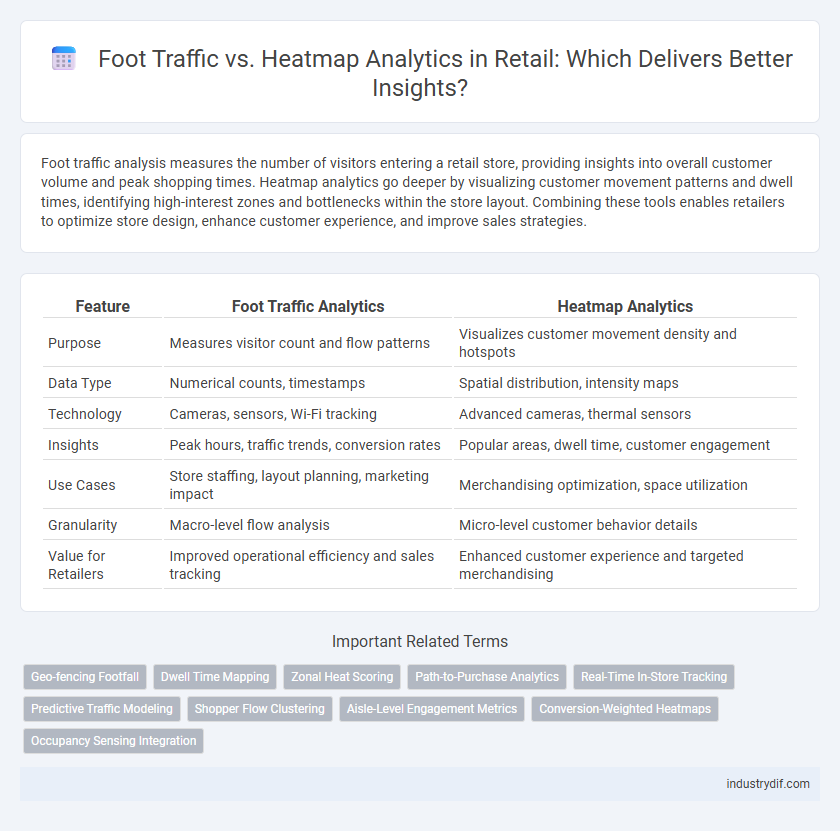
| Feature | Foot Traffic Analytics | Heatmap Analytics |
|---|---|---|
| Purpose | Measures visitor count and flow patterns | Visualizes customer movement density and hotspots |
| Data Type | Numerical counts, timestamps | Spatial distribution, intensity maps |
| Technology | Cameras, sensors, Wi-Fi tracking | Advanced cameras, thermal sensors |
| Insights | Peak hours, traffic trends, conversion rates | Popular areas, dwell time, customer engagement |
| Use Cases | Store staffing, layout planning, marketing impact | Merchandising optimization, space utilization |
| Granularity | Macro-level flow analysis | Micro-level customer behavior details |
| Value for Retailers | Improved operational efficiency and sales tracking | Enhanced customer experience and targeted merchandising |
Understanding Foot Traffic in Retail
Foot traffic analysis in retail provides critical insights into customer movement patterns and peak store hours, enabling optimized staffing and product placement. Heatmap analytics visually represent these patterns by highlighting high-traffic zones, improving store layout and promotional effectiveness. Leveraging foot traffic and heatmap data drives informed decisions to enhance customer experience and increase sales conversion rates.
What is Heatmap Analytics?
Heatmap analytics in retail visually represents customer movement and behavior by using color-coded maps that highlight high and low traffic areas within a store. This technology captures data from foot traffic patterns to identify popular zones, optimize store layout, and enhance product placement strategies. Leveraging heatmap analytics helps retailers increase sales performance by understanding shopper engagement and improving the in-store experience.
Foot Traffic Data: Collection Methods
Foot traffic data collection methods in retail primarily include infrared sensors, video camera analytics, and Bluetooth tracking, each providing accurate counts of visitors entering and moving through stores. Wi-Fi tracking captures customers' movements by detecting signals from their mobile devices, enabling detailed analysis of dwell times and popular areas. These methods collectively help retailers optimize store layouts, staffing, and marketing strategies based on real-time customer behavior insights.
Heatmap Analytics: How It Works
Heatmap analytics utilizes advanced sensors and AI-driven cameras to capture real-time customer movement and behavior within retail spaces. It converts this data into visual maps highlighting high-traffic zones, dwell times, and product interactions, enabling retailers to optimize store layouts and merchandising strategies effectively. This granular insight into shopper patterns enhances decision-making, boosts sales, and improves overall customer experience.
Comparing Foot Traffic and Heatmap Analytics
Foot traffic analytics quantifies the number of visitors entering and navigating a retail space, providing data on overall customer volume and peak visit times. Heatmap analytics visually represents customer movement patterns within the store, highlighting high-engagement zones and product interaction areas. Comparing these tools reveals that foot traffic analytics offers broad visitor metrics, while heatmap analytics delivers granular insights into in-store behavior, enabling optimized store layout and targeted merchandising strategies.
Benefits of Analyzing Foot Traffic
Analyzing foot traffic in retail environments provides valuable insights into customer behavior, enabling stores to optimize layout and product placement effectively. By understanding peak times and popular zones, retailers can enhance staffing efficiency and improve overall customer experience. Foot traffic data also supports targeted marketing strategies, driving increased sales and higher conversion rates.
Advantages of Heatmap Analytics in Retail
Heatmap analytics in retail provides detailed visualization of customer movement and engagement patterns within the store, enabling precise identification of high-traffic zones and product interaction areas. This data-driven insight helps retailers optimize store layouts, enhance product placement, and improve marketing strategies to boost sales and customer satisfaction. Compared to traditional foot traffic analysis, heatmaps offer granular, real-time analytics that support more informed decision-making for inventory management and promotional effectiveness.
Integrating Foot Traffic and Heatmap Insights
Integrating foot traffic data with heatmap analytics enables retailers to gain comprehensive insights into customer behavior and store performance. By combining visitor counts with spatial visualization of movement patterns, businesses can optimize store layouts, improve product placement, and enhance customer experience. This integration drives data-informed decisions that increase conversion rates and maximize retail revenue.
Impact on Store Layout and Merchandising
Foot traffic data reveals customer movement patterns, while heatmap analytics visually represent high-engagement zones within a store, enabling precise optimization of store layout and merchandising strategies. Leveraging heatmaps alongside foot traffic insights allows retailers to strategically position high-margin products in areas with the highest customer dwell time, enhancing conversion rates and sales performance. This data-driven approach improves store navigation, reduces congestion points, and maximizes product visibility to elevate the overall shopping experience.
Choosing the Right Analytics Tool for Your Retail Store
Selecting the right analytics tool for your retail store requires understanding the distinct advantages of foot traffic counting and heatmap analytics. Foot traffic data provides precise visitor counts essential for measuring overall store performance, while heatmap analytics reveal detailed insights into customer movement patterns and areas of high engagement within the store. Combining these tools enhances decision-making by optimizing store layouts, staffing, and marketing strategies based on comprehensive consumer behavior analysis.
Related Important Terms
Geo-fencing Footfall
Geo-fencing footfall analytics leverage location-based technology to create virtual boundaries, enabling retailers to monitor and analyze precise customer foot traffic patterns within specific areas. Integrating heatmap analytics with geo-fencing data enhances spatial understanding of shopper behavior, optimizing store layouts and marketing strategies to increase engagement and sales.
Dwell Time Mapping
Dwell time mapping in retail heatmap analytics provides precise insights into customer engagement by visually representing the duration shoppers spend in specific store areas, enabling optimized product placements and targeted marketing strategies. Analyzing foot traffic patterns alongside dwell time uncovers high-interest zones, driving enhanced store layout efficiency and improved sales performance.
Zonal Heat Scoring
Zonal Heat Scoring in retail leverages foot traffic data to identify high-activity areas within stores, optimizing product placement and store layout for increased customer engagement and sales. By analyzing heatmaps, retailers can pinpoint zones with maximum dwell time and footfall, enabling strategic decisions that enhance in-store experience and operational efficiency.
Path-to-Purchase Analytics
Path-to-purchase analytics in retail leverages foot traffic data combined with heatmap analytics to visualize customer movement patterns and identify high-conversion zones within stores. This integration enables retailers to optimize store layouts, improve product placement strategies, and enhance overall shopper engagement by understanding precise consumer behavior flows.
Real-Time In-Store Tracking
Real-time in-store tracking leverages foot traffic data combined with heatmap analytics to visualize customer movement patterns, optimizing store layout and product placement for increased engagement. Advanced sensor technology and AI-driven insights enable retailers to monitor congestion points and peak shopping times, enhancing operational efficiency and personalized marketing strategies.
Predictive Traffic Modeling
Predictive traffic modeling leverages historical foot traffic data combined with heatmap analytics to forecast store visit patterns and optimize product placement. This advanced approach enables retailers to anticipate peak hours, improve staffing efficiency, and enhance overall customer experience by identifying high-engagement zones within the store.
Shopper Flow Clustering
Shopper flow clustering leverages foot traffic and heatmap analytics to identify patterns in customer movement, helping retailers optimize store layouts for enhanced engagement and sales. By analyzing concentrated zones of activity, stores can strategically place high-demand products and promotional displays to maximize visibility and improve overall shopping experience.
Aisle-Level Engagement Metrics
Foot traffic analysis measures the number of customers entering a store, while heatmap analytics provide detailed aisle-level engagement metrics by tracking shopper movement and dwell time within specific store zones. Leveraging heatmap data enables retailers to optimize product placement, improve store layout, and enhance customer experience by identifying high-traffic aisles and pinpointing underperforming areas.
Conversion-Weighted Heatmaps
Conversion-weighted heatmaps integrate foot traffic data with sales conversion rates, enabling retailers to identify high-impact zones that drive both customer visits and purchase decisions. This advanced analytics approach optimizes store layouts by focusing on areas where increased foot traffic translates directly to higher sales, enhancing overall retail performance.
Occupancy Sensing Integration
Occupancy sensing integration enhances foot traffic analysis by providing real-time data on customer density and movement patterns, which improves the accuracy of heatmap analytics in retail environments. This synergy enables retailers to optimize store layouts, staffing, and marketing strategies based on precise occupancy metrics and detailed spatial insights.
Foot Traffic vs Heatmap Analytics Infographic