Illustration emphasizes creative expression and storytelling through hand-drawn or digitally crafted visuals, often conveying emotions and narratives. Data art transforms quantitative information into visual forms, blending aesthetics with analytical insights to reveal patterns and trends. Both forms uniquely bridge creativity and interpretation, yet illustration prioritizes imagination while data art centers on data-driven meaning.
Table of Comparison
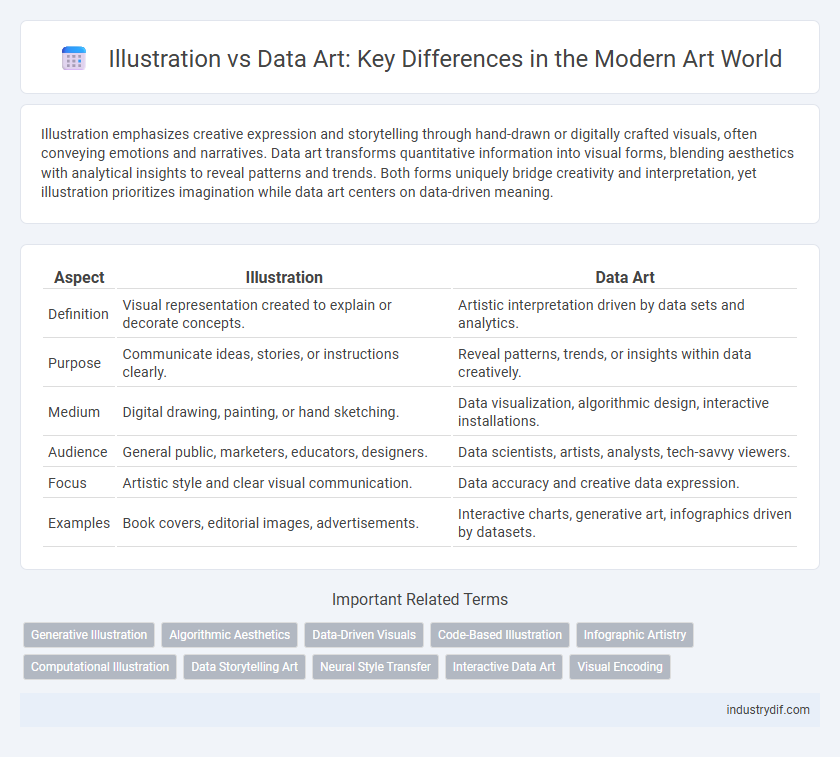
| Aspect | Illustration | Data Art |
|---|---|---|
| Definition | Visual representation created to explain or decorate concepts. | Artistic interpretation driven by data sets and analytics. |
| Purpose | Communicate ideas, stories, or instructions clearly. | Reveal patterns, trends, or insights within data creatively. |
| Medium | Digital drawing, painting, or hand sketching. | Data visualization, algorithmic design, interactive installations. |
| Audience | General public, marketers, educators, designers. | Data scientists, artists, analysts, tech-savvy viewers. |
| Focus | Artistic style and clear visual communication. | Data accuracy and creative data expression. |
| Examples | Book covers, editorial images, advertisements. | Interactive charts, generative art, infographics driven by datasets. |
Defining Illustration in the Arts Industry
Illustration in the arts industry serves as a visual communication tool that conveys ideas, narratives, or concepts through hand-drawn or digital imagery, often enhancing books, advertisements, or editorial content. It prioritizes clear storytelling and emotional engagement, employing techniques such as line art, shading, and color theory to evoke specific moods or themes. Unlike data art, which interprets information through abstract visuals, illustration is grounded in representational imagery tailored to complement textual or conceptual contexts.
What is Data Art?
Data art transforms raw data sets into visually compelling pieces that communicate complex information through artistic expression. Unlike traditional illustration, which primarily focuses on hand-drawn or digital imagery to represent ideas, data art integrates algorithms and data visualization techniques to reveal patterns and insights within the data itself. This fusion of technology and creativity turns abstract numbers into meaningful, interpretive visuals that engage and inform viewers beyond conventional graphic representation.
Historical Evolution: Illustration and Data Art
Illustration has evolved from traditional hand-drawn images used in manuscripts and print media to diverse digital formats that enhance storytelling and communication. Data art emerged more recently from the fusion of data visualization and creative expression, transforming raw information into visually compelling, interpretive artworks. Both forms reflect shifts in technology and cultural approaches to visual representation, with illustration rooted in representation and narrative, while data art emphasizes conceptual data-driven aesthetics.
Key Techniques in Illustration
Illustration primarily relies on hand-drawing, digital painting, and vector graphics to convey narrative and emotion, emphasizing line work, color theory, and composition. Techniques such as shading, perspective, and character design play crucial roles in creating visually compelling images that communicate complex ideas effectively. In contrast to data art, illustration focuses more on storytelling and artistic expression rather than representing data through abstract visuals and patterns.
Core Methods in Creating Data Art
Data art relies heavily on data visualization techniques and algorithm-driven processes to transform raw datasets into meaningful visual narratives, emphasizing accuracy and interpretability. Illustration focuses on manual techniques such as sketching, painting, and digital drawing, prioritizing artistic style and conceptual storytelling. Core methods in creating data art involve coding, statistical analysis, and interactive design to bridge the gap between abstract data and visual expression.
Major Applications: Illustration vs Data Art
Illustration primarily serves storytelling, branding, and advertising by creating visually engaging images that communicate ideas or narratives. Data art converts complex datasets into aesthetic visual forms, emphasizing patterns, insights, and emotional impact to facilitate understanding and analysis. Major applications of illustration include editorial design and marketing campaigns, while data art is widely used in scientific visualization, interactive installations, and urban planning.
Visual Storytelling Approaches
Illustration emphasizes hand-drawn or digitally created imagery to convey narratives with emotional and stylistic depth, often focusing on character and scene development. Data Art transforms raw data into visual forms, using abstraction and patterns to reveal hidden stories and insights through visualization techniques. Both approaches leverage visual storytelling but differ in execution, with illustration prioritizing expressive imagery and data art focusing on conveying complex information in an engaging format.
Industry Tools and Technologies
Illustration primarily relies on tools like Adobe Illustrator, Procreate, and CorelDRAW, enabling artists to create vector-based or hand-drawn visuals with precision and creativity. Data Art leverages technologies such as Python, D3.js, and Processing, focusing on transforming complex datasets into visually compelling and interactive representations. Both fields integrate software innovation, but Illustration emphasizes design software for static or animated graphics, while Data Art combines coding and visualization libraries to interpret data-driven aesthetics.
Career Paths: Illustrators vs Data Artists
Illustrators often pursue career paths in publishing, advertising, and entertainment, creating visual narratives that communicate ideas through hand-drawn or digital imagery. Data artists specialize in transforming complex datasets into compelling visualizations, working closely with technology firms, research institutions, and media outlets to make information accessible and engaging. Both fields demand strong artistic skills but differ in technical expertise, with data artists requiring proficiency in programming and data analysis tools.
Future Trends in Illustration and Data Art
Future trends in illustration emphasize immersive experiences using augmented reality (AR) and virtual reality (VR) to create interactive narratives. Data art is increasingly leveraging artificial intelligence (AI) and machine learning algorithms to transform complex datasets into dynamic visualizations. Both fields are converging towards hybrid forms that blend human creativity with advanced technology to enhance storytelling and data interpretation.
Related Important Terms
Generative Illustration
Generative illustration leverages algorithms and AI to create unique, dynamic visuals that adapt and evolve, blending creativity with computational power. Unlike data art, which primarily visualizes raw data sets to communicate information, generative illustration emphasizes aesthetic innovation and artistic expression through procedural generation techniques.
Algorithmic Aesthetics
Illustration emphasizes narrative clarity and handcrafted details, whereas Data Art leverages algorithmic aesthetics to transform complex datasets into dynamic visual forms, highlighting patterns and abstractions beyond traditional representation. Algorithmic aesthetics in Data Art utilize computational processes to generate evolving visuals that challenge conventional artistic boundaries through code-driven creativity.
Data-Driven Visuals
Data-driven visuals in illustration emphasize narrative clarity through storytelling elements, while data art transforms complex datasets into abstract, interpretive forms that evoke emotional responses and conceptual insights. Illustration often uses structured imagery to convey specific messages, whereas data art prioritizes aesthetic exploration and data visualization as an artistic medium.
Code-Based Illustration
Code-based illustration harnesses programming languages and algorithms to create precise, scalable visuals that combine artistic creativity with technical accuracy. Unlike data art, which transforms complex datasets into expressive visual narratives, code-based illustration emphasizes meticulous design control through scripted generation of shapes, colors, and patterns.
Infographic Artistry
Illustration emphasizes creative storytelling through handcrafted visuals, while data art transforms complex datasets into visually engaging and informative representations. Infographic artistry merges these approaches, crafting visually compelling narratives that simplify data interpretation without sacrificing aesthetic appeal.
Computational Illustration
Computational illustration leverages algorithmic processes and digital tools to create detailed, dynamic visual representations that enhance storytelling and data comprehension. Unlike data art, which often prioritizes abstract interpretation and aesthetic expression, computational illustration focuses on precise, information-rich imagery that supports clarity and usability in visual communication.
Data Storytelling Art
Data Storytelling Art merges visualization techniques with narrative elements to transform complex datasets into compelling, easily understandable stories. This approach enhances audience engagement by combining the precision of data art with the emotive power of illustration, making abstract information accessible and impactful.
Neural Style Transfer
Neural Style Transfer bridges Illustration and Data Art by transforming photographic content into visually striking artworks that mimic artistic styles, enhancing data visualization with aesthetic depth. This technique leverages convolutional neural networks to merge content and style layers, allowing illustrators and data artists to create compelling, semantically rich images that convey both emotional resonance and informational complexity.
Interactive Data Art
Interactive data art transforms complex datasets into immersive experiences by combining visual storytelling with user engagement, allowing audiences to explore patterns and insights dynamically. Unlike traditional illustration, which often presents static visuals, this art form leverages technology and interactivity to create evolving narratives driven by real-time data interactions.
Visual Encoding
Illustration employs visual encoding through recognizable symbols and narrative imagery to convey ideas and emotions, emphasizing artistic expression and storytelling. Data Art transforms raw data into abstract visual forms using color, shape, and spatial arrangements to reveal patterns and insights beyond traditional graphs, prioritizing informational clarity and aesthetic innovation.
Illustration vs Data Art Infographic