Foot traffic data provides a quantitative measure of the number of customers entering a retail space, essential for analyzing overall store performance and peak hours. Heatmapping enhances this by visually representing customer movement and dwell times within the store, revealing high-interest zones and potential bottlenecks. Combining foot traffic with heatmapping allows retailers to optimize store layout, product placement, and staffing to improve customer experience and increase sales.
Table of Comparison
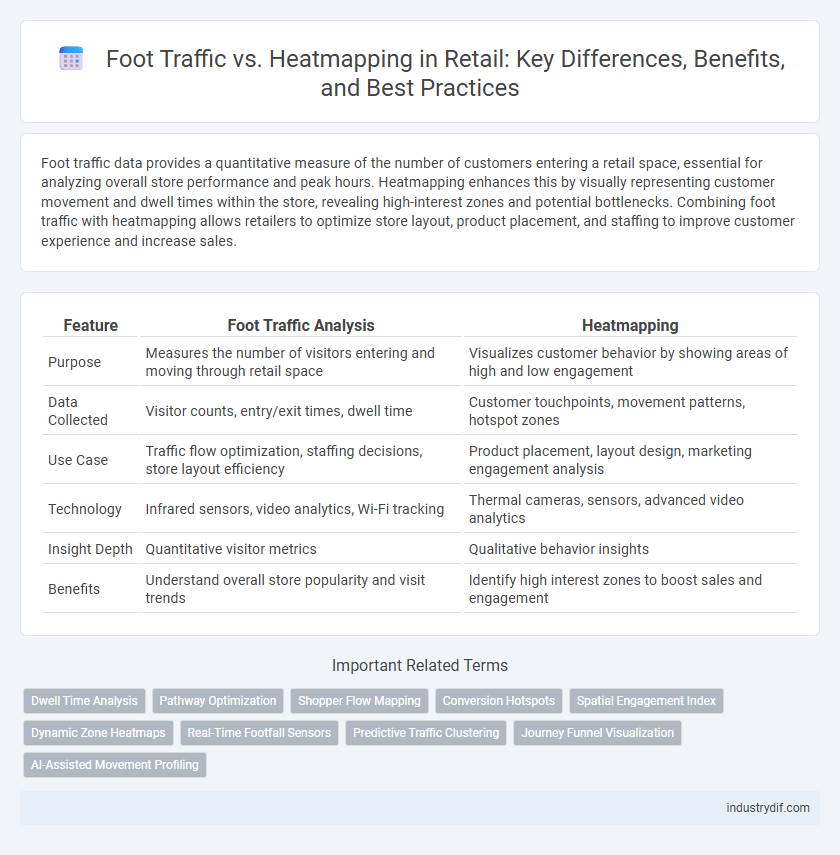
| Feature | Foot Traffic Analysis | Heatmapping |
|---|---|---|
| Purpose | Measures the number of visitors entering and moving through retail space | Visualizes customer behavior by showing areas of high and low engagement |
| Data Collected | Visitor counts, entry/exit times, dwell time | Customer touchpoints, movement patterns, hotspot zones |
| Use Case | Traffic flow optimization, staffing decisions, store layout efficiency | Product placement, layout design, marketing engagement analysis |
| Technology | Infrared sensors, video analytics, Wi-Fi tracking | Thermal cameras, sensors, advanced video analytics |
| Insight Depth | Quantitative visitor metrics | Qualitative behavior insights |
| Benefits | Understand overall store popularity and visit trends | Identify high interest zones to boost sales and engagement |
Understanding Foot Traffic in Retail
Foot traffic analysis in retail measures the number and movement patterns of customers entering and navigating a store, providing critical insights into shopper behavior. Heatmapping technology visualizes these patterns by highlighting high-traffic zones, revealing hotspots and underutilized areas within the store layout. Leveraging foot traffic and heatmapping data allows retailers to optimize store design, product placement, and staffing to enhance customer experience and increase sales.
What is Heatmapping Technology?
Heatmapping technology in retail uses advanced sensors and data analytics to visualize customer movement patterns and dwell times within a store. By capturing real-time foot traffic density, heatmaps identify high-engagement zones and underperforming areas, enabling retailers to optimize store layouts and product placements. This technology enhances decision-making, driving increased sales and improved customer experiences.
Key Differences: Foot Traffic and Heatmapping
Foot traffic measures the number of customers entering and moving through a retail space, providing quantitative data on visitor frequency and flow patterns. Heatmapping visualizes customer behavior by highlighting areas of high engagement and dwell time within the store using color-coded graphics. Key differences include foot traffic's focus on volume and entry points, while heatmapping emphasizes spatial interaction and in-store navigation insights.
Benefits of Analyzing Foot Traffic Data
Analyzing foot traffic data in retail provides critical insights into customer behavior, enabling stores to optimize layouts and product placements for increased engagement. Heatmapping technology visually represents high-traffic zones, helping retailers identify popular areas and adjust marketing strategies accordingly. Leveraging these insights improves store efficiency, boosts sales, and enhances the overall shopping experience.
How Heatmaps Enhance Store Layout Optimization
Heatmaps provide detailed visual insights into customer movement patterns, enabling retailers to identify high-traffic zones and underutilized areas within a store. By analyzing these behavior patterns, stores can strategically place merchandise and optimize shelf layouts to increase engagement and sales. Leveraging heatmap data leads to improved store layout planning, maximizing foot traffic flow and enhancing overall shopping experience efficiency.
Integrating Foot Traffic Metrics with Heatmaps
Integrating foot traffic metrics with heatmapping technology enables retailers to visualize customer movement patterns and identify high-engagement zones within stores. This combination provides granular data on shopper behavior, optimizing product placement and store layout to maximize conversion rates. Utilizing advanced analytics from foot traffic sensors alongside real-time heatmaps enhances decision-making for merchandising and marketing strategies in retail environments.
Real-Time Data: Foot Traffic vs Heatmaps
Real-time foot traffic data captures the number of customers entering and moving through a retail space, providing immediate insights into store occupancy and peak hours. Heatmapping visualizes this data by highlighting high-traffic zones within the store, enabling retailers to optimize product placement and staff allocation. Combining these techniques allows for dynamic decision-making that enhances customer experience and increases sales efficiency.
Case Studies: Foot Traffic & Heatmap Success Stories
Case studies reveal that retailers leveraging foot traffic analysis alongside heatmapping technologies achieve up to 30% increases in in-store engagement and sales. Brands like Walmart and Zara have successfully optimized store layouts by integrating heatmap data with real-time foot traffic patterns, resulting in enhanced customer flow and product placement. This data-driven approach reduces bottlenecks and boosts conversion rates by identifying high-traffic zones and tailoring marketing strategies accordingly.
Choosing the Right Solution for Your Retail Business
Foot traffic analysis provides quantitative data on the number of visitors entering a retail space, while heatmapping offers detailed insights into customer movement patterns and dwell times within specific areas. Selecting the right solution depends on your business goals; foot traffic metrics are ideal for measuring overall store performance, whereas heatmapping delivers actionable data to optimize store layout and product placement. Integrating both tools can maximize retail efficiency by combining visitor counts with in-depth behavioral analytics.
Future Trends: Evolving Analytics in Retail Spaces
Foot traffic analysis is evolving beyond simple counts to integrate with advanced heatmapping technologies that provide granular insights into customer movement and dwell times. Future retail analytics will leverage AI-driven heatmaps combined with IoT sensors to optimize store layout, personalize marketing strategies, and enhance overall shopper experience. Emerging trends indicate a shift towards real-time, predictive analytics that enable dynamic space management and increased operational efficiency.
Related Important Terms
Dwell Time Analysis
Dwell time analysis in retail leverages foot traffic data and heatmapping to identify high-engagement zones within stores, revealing where customers spend the most time and enhancing layout optimization. Integrating real-time heatmaps with precise foot traffic counts enables retailers to strategically position products, improve customer experience, and increase conversion rates.
Pathway Optimization
Heatmapping technology provides detailed visualization of customer movement patterns, enabling retailers to optimize store layouts by identifying high-traffic zones and bottlenecks. Foot traffic data, when combined with heatmaps, allows for strategic pathway adjustments that enhance shopper flow, increase engagement with key displays, and improve overall sales performance.
Shopper Flow Mapping
Shopper flow mapping enhances retail strategies by tracking foot traffic patterns to identify high-traffic zones and optimize store layouts for improved customer engagement. Integrating heatmapping data with foot traffic analytics enables precise visualization of shopper movement, driving targeted merchandising and increased sales conversion rates.
Conversion Hotspots
Conversion hotspots in retail are identified by analyzing foot traffic patterns alongside heatmapping data, revealing areas where customer engagement and purchasing likelihood peak. Optimizing store layout based on these insights enhances product placement, increases dwell time, and drives higher sales conversion rates.
Spatial Engagement Index
Foot Traffic measures the total number of visitors entering a retail space, providing a broad overview of customer volume, while Heatmapping captures detailed movement patterns within the store, visualizing areas of high engagement. The Spatial Engagement Index combines these insights by quantifying the intensity and duration of customer interactions in specific zones, optimizing layout efficiency and marketing strategies for enhanced retail performance.
Dynamic Zone Heatmaps
Dynamic zone heatmaps provide retailers with granular insights into customer movement patterns by visualizing foot traffic intensity within specific store areas, enabling optimized product placement and layout adjustments. These heatmaps leverage real-time data to identify high-engagement zones and underutilized spaces, driving strategic decisions to enhance shopper experience and increase sales conversion rates.
Real-Time Footfall Sensors
Real-time footfall sensors provide accurate, instantaneous data on customer movement patterns, outperforming traditional heatmapping by delivering dynamic insights into peak traffic areas and dwell times within retail spaces. These sensors enable retailers to optimize store layouts, improve staffing efficiency, and enhance customer experience through data-driven decision-making.
Predictive Traffic Clustering
Predictive traffic clustering leverages heatmapping data to analyze and forecast foot traffic patterns within retail spaces, enabling optimized store layouts and targeted marketing strategies. By identifying high-traffic zones and customer movement trends, retailers can enhance shopper engagement and maximize revenue potential.
Journey Funnel Visualization
Foot traffic analysis quantifies customer presence at key store locations, while heatmapping visually represents movement intensity and dwell times, enabling a comprehensive journey funnel visualization that identifies drop-off points and optimizes store layout for enhanced conversion rates. Integrating these data-driven insights allows retailers to strategically design customer pathways, improve product placements, and maximize engagement throughout the shopping experience.
AI-Assisted Movement Profiling
AI-assisted movement profiling integrates advanced heatmapping technologies to analyze foot traffic patterns with precision, enabling retailers to identify high-engagement zones and optimize store layouts for increased customer interaction. By leveraging machine learning algorithms to interpret real-time movement data, retailers can enhance merchandising strategies and improve overall in-store experience.
Foot Traffic vs Heatmapping Infographic