Box office analytics offer insights into theatrical release performance, measuring ticket sales, audience demographics, and regional trends to guide marketing and distribution strategies. Streaming analytics track viewer engagement, subscription growth, and content popularity on digital platforms, enabling real-time adjustments to programming and personalized recommendations. Comparing these analytics helps entertainment companies optimize content delivery and maximize revenue across both physical and digital channels.
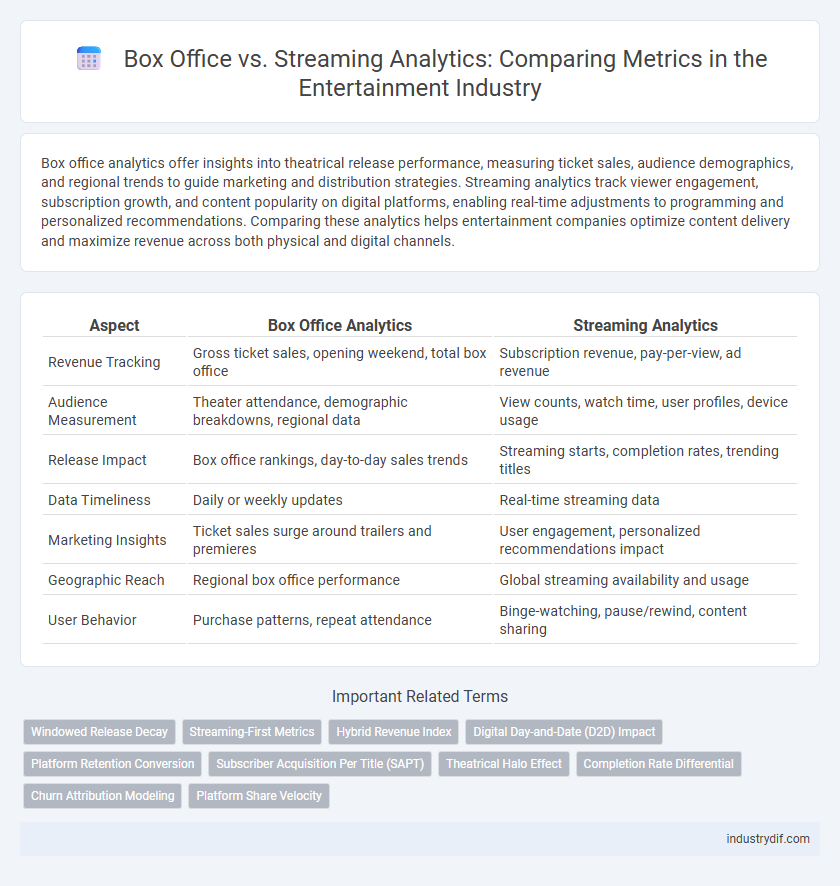
Table of Comparison
| Aspect | Box Office Analytics | Streaming Analytics |
|---|---|---|
| Revenue Tracking | Gross ticket sales, opening weekend, total box office | Subscription revenue, pay-per-view, ad revenue |
| Audience Measurement | Theater attendance, demographic breakdowns, regional data | View counts, watch time, user profiles, device usage |
| Release Impact | Box office rankings, day-to-day sales trends | Streaming starts, completion rates, trending titles |
| Data Timeliness | Daily or weekly updates | Real-time streaming data |
| Marketing Insights | Ticket sales surge around trailers and premieres | User engagement, personalized recommendations impact |
| Geographic Reach | Regional box office performance | Global streaming availability and usage |
| User Behavior | Purchase patterns, repeat attendance | Binge-watching, pause/rewind, content sharing |
Introduction to Box Office and Streaming Analytics
Box office analytics track theatrical film performance by measuring ticket sales, revenue, and audience demographics to gauge commercial success and market trends. Streaming analytics focus on digital platform metrics such as viewership numbers, subscriber engagement, content popularity, and retention rates to optimize content strategy and distribution. Combining these data sources enables comprehensive insights into consumer behavior and entertainment consumption patterns across formats.
Key Metrics: Comparing Box Office Gross with Streaming Views
Box office gross remains a critical metric for gauging theatrical success, reflecting total revenue from ticket sales worldwide. Streaming views offer granular insights into audience engagement, measuring not only total view counts but also completion rates and viewer demographics. Comparing these key metrics provides a comprehensive understanding of entertainment performance across traditional and digital platforms.
Data Collection Methods in Theatrical vs Digital Platforms
Data collection methods in theatrical box office rely heavily on point-of-sale systems and manual reporting from cinema exhibitors, capturing ticket sales, showtimes, and audience demographics in real time. Streaming platforms utilize advanced analytics through embedded user tracking, capturing detailed viewer behavior such as watch time, pause rates, and content preferences via digital telemetry. This contrast in data granularity enables theatrical analytics to focus on aggregate attendance trends, while streaming analytics provide more precise, individualized consumption patterns for entertainment companies.
Revenue Models: Ticket Sales vs Subscription Earnings
Box office revenue models primarily depend on ticket sales, generating income through individual purchases per movie screening, which often leads to significant spikes during blockbuster releases. Streaming platforms rely on subscription earnings, providing a steady and predictable cash flow by charging users monthly or annual fees for unlimited content access. Analyzing these revenue streams highlights how box office success hinges on event-driven crowds, while streaming profits benefit from subscriber retention and scalable digital distribution.
Audience Demographics and Engagement Insights
Box office analytics reveal that audiences aged 25 to 45 dominate ticket sales, driven by blockbuster franchises and cinematic events. Streaming platforms gather granular demographic data, highlighting diverse viewer preferences across age, gender, and region, enabling personalized content recommendations. Engagement metrics on streaming services, such as watch time and completion rates, provide deeper insights into audience behavior compared to pure box office revenue figures.
Transparency and Reporting Standards in Both Sectors
Box office analytics rely on established transparency and standardized reporting protocols, offering verifiable ticket sales data through industry-wide aggregators like Comscore and Box Office Mojo. Streaming services often maintain proprietary metrics with limited external validation, resulting in less transparent audience insights compared to theatrical releases. Enhanced reporting standards and third-party audits in streaming analytics could bridge the gap, fostering industry-wide trust and informed decision-making.
Impact of Real-Time Analytics on Distribution Strategies
Real-time analytics revolutionize distribution strategies by enabling studios to monitor box office performance and streaming viewership simultaneously, optimizing release windows and marketing efforts. Data-driven insights allow distributors to adjust promotional campaigns dynamically, targeting audiences with tailored content on multiple platforms to maximize revenue. The integration of box office and streaming analytics enhances decision-making, ensuring content reaches the right market at the ideal time for peak engagement and profitability.
Measuring Success: Blockbusters vs Streaming Hits
Box office performance gauges blockbuster success through ticket sales, offering immediate revenue metrics and audience turnout insights. Streaming analytics measure hits by tracking view counts, subscriber retention, and engagement duration, providing a nuanced understanding of content popularity over time. Comparing these data points highlights the evolving landscape where traditional theaters quantify success via gross earnings, while digital platforms emphasize sustained user interaction and binge-watch trends.
Challenges in Cross-Platform Performance Comparison
Analyzing box office revenue alongside streaming viewership presents significant challenges due to differing data measurement standards and audience behavior metrics across platforms. Traditional box office performance is quantified through ticket sales and revenue, while streaming relies on complex algorithms tracking viewer engagement, completion rates, and subscriber growth. This disparity complicates direct performance comparison, rendering cross-platform analytics essential but inherently complex for accurately assessing entertainment industry success.
Future Trends: Evolving Analytics in Entertainment Industry
Future trends in entertainment analytics reveal a growing integration of box office data with streaming metrics to provide a comprehensive view of audience engagement and revenue streams. Advanced machine learning algorithms analyze real-time streaming behavior alongside traditional ticket sales, enhancing predictive accuracy for content performance and marketing strategies. This evolution enables studios and platforms to optimize release windows, tailor content creation, and maximize profitability across both theatrical and digital landscapes.
Related Important Terms
Windowed Release Decay
Windowed release decay in entertainment analytics measures the decline in consumer interest and revenue across sequential distribution platforms, from theatrical box office to streaming services. This decay quantifies how audience engagement and monetization diminish over time, highlighting the strategic timing differences between exclusive theatrical windows and streaming releases.
Streaming-First Metrics
Streaming-first metrics prioritize viewer engagement, subscriber growth, and content completion rates over traditional box office revenue, offering real-time insights into audience preferences and behavior. These data-driven analytics enable studios to tailor content strategies, optimize release schedules, and enhance personalized recommendations, transforming entertainment distribution in the digital era.
Hybrid Revenue Index
The Hybrid Revenue Index combines box office earnings and streaming revenue to provide a comprehensive metric reflecting a film's overall financial performance. This index enables studios and analysts to evaluate consumer behavior across theatrical releases and digital platforms, optimizing distribution strategies in the evolving entertainment landscape.
Digital Day-and-Date (D2D) Impact
Digital Day-and-Date (D2D) releases significantly influence box office revenue, often cannibalizing theater attendance while boosting streaming platform subscriptions and engagement metrics. Data analytics reveal that films available simultaneously in theaters and on streaming services tend to generate higher overall viewership but face reduced traditional box office earnings, reshaping distribution strategies in the entertainment industry.
Platform Retention Conversion
Box office analytics emphasize theatrical audience turnout and revenue trends, while streaming analytics prioritize platform retention and subscriber conversion metrics to gauge long-term engagement. Advanced data models track viewer behavior, highlighting how retention rates impact lifetime value and influence content acquisition strategies for streaming services.
Subscriber Acquisition Per Title (SAPT)
Subscriber Acquisition Per Title (SAPT) measures the effectiveness of individual movies or series in driving new streaming platform sign-ups compared to traditional box office revenue metrics. Leveraging SAPT data enables entertainment companies to optimize content investment by identifying titles with the highest subscriber conversion rates, offering a more direct correlation to revenue growth than box office gross alone.
Theatrical Halo Effect
The theatrical halo effect significantly boosts streaming viewership by increasing audience awareness and anticipation, leading to higher post-release digital rentals and subscriptions. Box office success serves as a key predictor in streaming performance, with films that perform well in theaters often experiencing extended revenue life cycles across digital platforms.
Completion Rate Differential
Box office analytics track total ticket sales and revenue, while streaming analytics emphasize viewer engagement metrics such as completion rate, which measures the percentage of content watched to the end. A higher completion rate differential in streaming indicates stronger audience retention compared to traditional box office performance, highlighting shifting consumer behavior in entertainment consumption.
Churn Attribution Modeling
Churn attribution modeling in entertainment leverages box office and streaming analytics to identify patterns that predict customer attrition by analyzing ticket sales, viewing habits, and subscription data. Integrating these datasets enhances accuracy in forecasting churn, enabling targeted retention strategies and optimized revenue streams.
Platform Share Velocity
Platform share velocity reveals the rapid shifts in audience engagement between box office releases and streaming platforms, highlighting how streaming services accelerate revenue capture through immediate, data-driven distribution. Analyzing real-time viewing metrics versus traditional ticket sales helps entertainment companies optimize content strategies and predict market trends with greater accuracy.
Box Office vs Streaming Analytics Infographic