Foot traffic analysis measures the number of customers entering a retail store, providing insights into overall store popularity and peak visit times. Heat mapping visualizes customer movement patterns within the store, highlighting high-traffic zones and areas where shoppers engage most with products. Combining foot traffic data with heat mapping enables retailers to optimize store layout, improve product placement, and increase sales conversions.
Table of Comparison
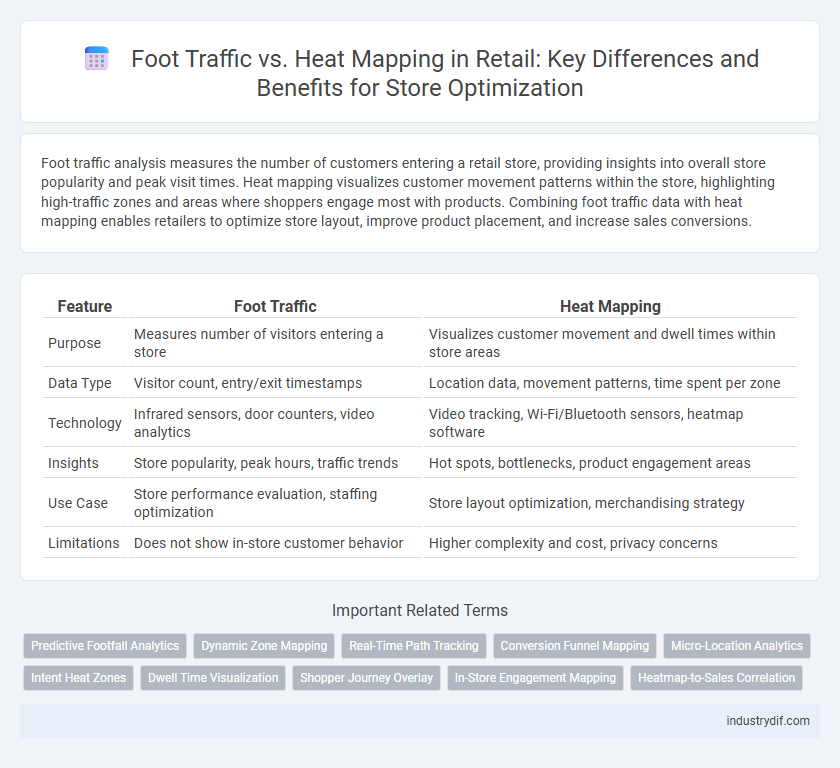
| Feature | Foot Traffic | Heat Mapping |
|---|---|---|
| Purpose | Measures number of visitors entering a store | Visualizes customer movement and dwell times within store areas |
| Data Type | Visitor count, entry/exit timestamps | Location data, movement patterns, time spent per zone |
| Technology | Infrared sensors, door counters, video analytics | Video tracking, Wi-Fi/Bluetooth sensors, heatmap software |
| Insights | Store popularity, peak hours, traffic trends | Hot spots, bottlenecks, product engagement areas |
| Use Case | Store performance evaluation, staffing optimization | Store layout optimization, merchandising strategy |
| Limitations | Does not show in-store customer behavior | Higher complexity and cost, privacy concerns |
Understanding Foot Traffic in Retail
Foot traffic quantifies the number of customers entering a retail location, offering critical insights into peak shopping times and store performance. Accurate foot traffic data enables retailers to optimize staff allocation, enhance marketing strategies, and improve customer experience. Heat mapping complements this by visually representing high-traffic zones, guiding strategic product placements and store layout decisions.
What is Heat Mapping?
Heat mapping in retail visualizes customer movement and behavior by using color-coded data overlays on store layouts to identify high-traffic zones and engagement hotspots. This technique employs sensors, cameras, or Wi-Fi tracking to gather real-time information, enabling retailers to optimize store design, product placement, and marketing strategies. Heat mapping provides detailed insights beyond mere foot traffic counts, highlighting dwell times and shopper interactions for enhanced decision-making.
Key Differences: Foot Traffic vs Heat Mapping
Foot traffic measures the number of visitors entering a retail space, providing quantitative data on customer volume and peak shopping times. Heat mapping visualizes customer movement patterns within the store, highlighting high-engagement zones and product interaction areas through color-coded spatial analysis. Combining foot traffic counts with heat mapping insights enables retailers to optimize store layouts, enhance product placements, and improve overall customer experience.
Data Collection Methods in Retail Analytics
Foot traffic analysis in retail leverages sensors, cameras, and mobile data to quantify the number of customers entering and moving through stores, providing crucial metrics on visit frequency and peak hours. Heat mapping utilizes advanced infrared or Wi-Fi tracking technologies to visualize customer movement patterns and dwell times within specific store areas, highlighting high-engagement zones. Combining these data collection methods enables retailers to optimize store layouts, improve product placement strategies, and enhance the overall shopping experience based on precise behavioral insights.
Benefits of Foot Traffic Analysis
Foot traffic analysis provides retailers with precise data on customer movement patterns, enabling optimized store layout and product placement to increase sales conversions. Understanding peak visit times and high-traffic zones helps allocate staff efficiently, enhancing customer service and operational efficiency. This data-driven approach supports targeted marketing efforts, ultimately driving higher engagement and revenue growth.
Advantages of Heat Mapping Technology
Heat mapping technology offers granular insights into customer movement by visually representing foot traffic patterns, enabling retailers to identify high-traffic zones and optimize store layouts for increased engagement. Unlike traditional foot traffic counters, heat maps reveal dwell times and interaction hotspots, providing actionable data to boost product placement and promotional effectiveness. Integrating heat mapping with sales analytics enhances decision-making, resulting in improved customer experience and higher conversion rates.
Applications of Foot Traffic Data
Foot traffic data enables retailers to analyze customer movement patterns, optimize store layouts, and strategically position products to enhance sales conversions. Heat mapping visualizes these movement trends by highlighting high and low traffic areas, allowing for precise inventory placement and efficient staffing. Leveraging foot traffic insights improves marketing effectiveness and supports data-driven decision-making in retail operations.
Leveraging Heat Maps for Retail Layout Optimization
Heat mapping technology provides detailed visual insights into customer movement patterns and dwell times within retail spaces, enabling precise identification of high-traffic zones and underutilized areas. By analyzing heat maps, retailers can strategically design store layouts to enhance product placement, improve customer flow, and increase exposure to promotional displays. Leveraging this data-driven approach results in optimized floor plans that drive higher sales conversion rates and improve overall shopping experience.
Integrating Foot Traffic and Heat Mapping Solutions
Integrating foot traffic data with heat mapping technology provides retailers with precise insights into customer movement and behavior patterns inside stores. Combining these solutions enables optimization of store layout, product placement, and staffing based on high-traffic zones identified through real-time heat maps. Retailers leveraging integrated foot traffic and heat mapping analytics can enhance the overall shopping experience, increase conversion rates, and maximize operational efficiency.
Future Trends in Retail Store Analytics
Foot traffic analysis provides quantitative data on customer volume and movement patterns, while heat mapping offers detailed spatial visualization of engagement hotspots within retail spaces. Future trends in retail store analytics emphasize integrating AI-powered heat maps with real-time foot traffic data to optimize store layouts and enhance personalized marketing strategies. Advanced sensor technologies and machine learning algorithms will drive predictive insights, enabling retailers to improve customer experience and boost sales efficiency.
Related Important Terms
Predictive Footfall Analytics
Predictive footfall analytics leverages heat mapping technology to analyze customer movement patterns in retail spaces, enabling retailers to forecast peak shopping times and optimize store layouts. By integrating real-time data with historical foot traffic trends, predictive models enhance inventory management and marketing strategies, driving increased sales and improved customer experiences.
Dynamic Zone Mapping
Dynamic Zone Mapping leverages real-time foot traffic data to create adaptive heat maps that highlight customer movement patterns and high-engagement areas within retail spaces. This technology enables retailers to optimize store layouts, product placements, and marketing strategies by continuously tracking and analyzing fluctuating consumer behavior.
Real-Time Path Tracking
Real-time path tracking leverages advanced heat mapping technology to analyze foot traffic patterns within retail spaces, enabling precise monitoring of customer movements and high-density zones. This data-driven approach enhances store layout optimization and targeted product placement, significantly boosting shopper engagement and sales performance.
Conversion Funnel Mapping
Foot traffic analysis quantifies the number of visitors entering a store, while heat mapping visually represents customer movement patterns to identify high-engagement zones; integrating these tools enhances conversion funnel mapping by pinpointing where customers transition from browsing to purchasing. Conversion funnel mapping leverages combined data to optimize store layouts, product placements, and targeted marketing strategies, driving higher conversion rates and improving overall retail performance.
Micro-Location Analytics
Micro-location analytics in retail leverage foot traffic data combined with heat mapping to identify precise customer movement patterns within store zones, enhancing product placement strategies and optimizing store layouts. By analyzing these spatial behaviors at a granular level, retailers can boost conversion rates and tailor marketing efforts to high-engagement areas.
Intent Heat Zones
Foot traffic analysis quantifies the number of visitors in retail spaces, while heat mapping visualizes Intent Heat Zones that identify high-engagement areas where customers interact with products. Leveraging Intent Heat Zones allows retailers to optimize store layouts and product placements, driving increased conversion rates and sales performance.
Dwell Time Visualization
Dwell time visualization enhances foot traffic analysis by pinpointing areas where customers spend the most time, enabling retailers to optimize store layouts and product placements effectively. Integrating heat mapping with dwell time data provides actionable insights into shopper behavior, driving targeted marketing strategies and improving overall store performance.
Shopper Journey Overlay
Shopper journey overlay integrates foot traffic data with heat mapping to visually represent customer movement patterns and dwell times within retail spaces. This combined analysis enhances store layout optimization, product placement, and personalized marketing strategies by pinpointing high-traffic areas and shopper behavior trends.
In-Store Engagement Mapping
Foot traffic data quantifies the number of customers entering a retail space, while heat mapping visually represents in-store engagement by identifying high-activity zones where customers spend the most time. Leveraging heat mapping technology enhances strategic placement of products and promotional displays, optimizing shopper experience and maximizing conversion rates.
Heatmap-to-Sales Correlation
Heatmap analytics in retail reveal high-density zones correlating directly with increased sales, enabling optimization of store layouts to maximize revenue. By analyzing foot traffic patterns through heat mapping, retailers identify profitable product placements and improve customer engagement strategies.
Foot Traffic vs Heat Mapping Infographic