Planograms provide a structured visual representation of product placement on retail shelves to maximize space efficiency and promote sales. Heat mapping analyzes customer behavior by tracking foot traffic and product interaction areas, offering insights to optimize store layout and product positioning. Combining planogram precision with heat mapping data enhances merchandising strategies and improves overall retail performance.
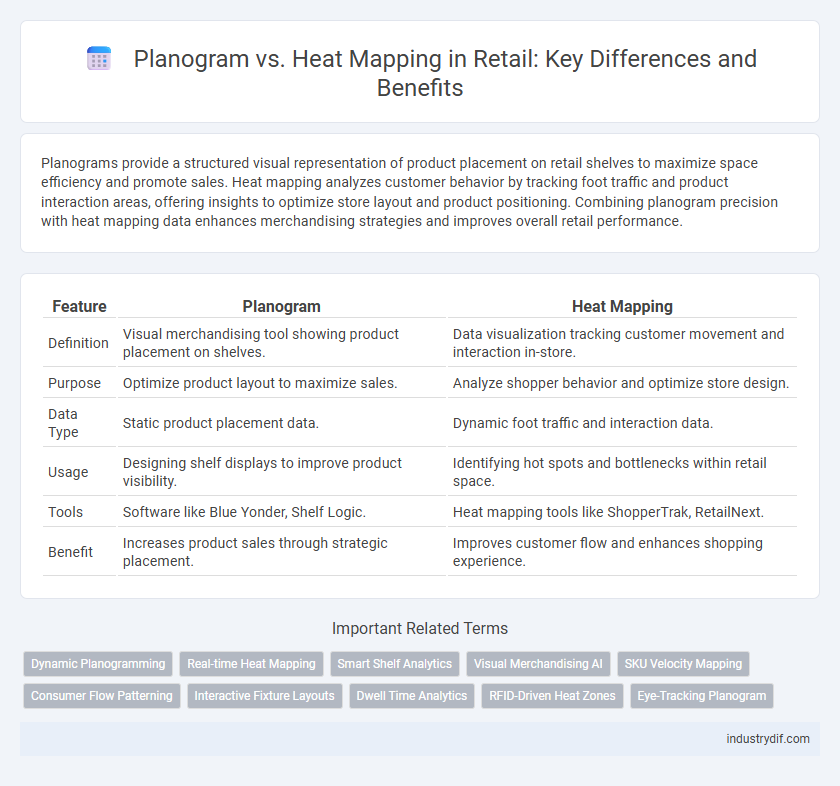
Table of Comparison
| Feature | Planogram | Heat Mapping |
|---|---|---|
| Definition | Visual merchandising tool showing product placement on shelves. | Data visualization tracking customer movement and interaction in-store. |
| Purpose | Optimize product layout to maximize sales. | Analyze shopper behavior and optimize store design. |
| Data Type | Static product placement data. | Dynamic foot traffic and interaction data. |
| Usage | Designing shelf displays to improve product visibility. | Identifying hot spots and bottlenecks within retail space. |
| Tools | Software like Blue Yonder, Shelf Logic. | Heat mapping tools like ShopperTrak, RetailNext. |
| Benefit | Increases product sales through strategic placement. | Improves customer flow and enhances shopping experience. |
Understanding Planograms in Retail Management
Planograms are visual merchandising tools that strategically organize products on shelves to maximize sales and optimize shelf space in retail stores. By detailing product placement based on consumer buying habits and store layout, planograms improve inventory management and enhance the shopping experience. Integrating planograms with heat mapping data reveals customer movement patterns, enabling retailers to adjust displays for increased engagement and higher conversion rates.
What is Heat Mapping? A Retail Perspective
Heat mapping in retail is a visual analytics tool that tracks and displays customer movement patterns, dwell times, and areas of highest engagement within a store. By using heat maps, retailers can identify high-traffic zones and optimize product placement to enhance shopper experience and increase sales efficiency. This data-driven approach provides actionable insights into consumer behavior, enabling precise inventory management and targeted marketing strategies.
Planogram: Key Benefits for Store Layout Optimization
Planograms provide precise visual representations of product placement, ensuring consistent store layouts that enhance shopper navigation and maximize shelf space utilization. By strategically organizing merchandise based on sales data and customer behavior, planograms drive higher sales and improve inventory management. Retailers benefit from reduced stockouts, improved product visibility, and increased operational efficiency through systematic shelf arrangement.
Heat Mapping: Uncovering Customer Behavior Patterns
Heat mapping reveals detailed customer behavior by visually tracking foot traffic and product interaction hotspots within retail spaces, enabling precise optimization of store layout and merchandise placement. This data-driven approach highlights areas of high engagement and uncovers shopper preferences, facilitating targeted marketing strategies and inventory management. Compared to planograms, heat mapping provides dynamic, real-time insights into how customers navigate and interact with the retail environment, enhancing decision-making for improved sales performance.
Planogram vs Heat Mapping: Core Differences
Planograms organize product placement visually based on sales data and category management to maximize shelf efficiency, while heat mapping tracks customer movement and engagement patterns within the store to identify high-traffic zones. Planograms emphasize inventory arrangement and plan execution aligned with merchandising strategy, whereas heat mapping focuses on consumer behavior insights and optimizing store layout for improved foot traffic and sales conversion. Both tools complement retail optimization, combining planned product display with real-time customer interaction data for enhanced decision-making.
When to Use Planograms in Your Retail Strategy
Planograms should be used in retail when precise product placement and shelf organization are critical to maximize space efficiency and improve inventory management. Employing planograms helps retailers ensure consistent visual merchandising aligned with brand standards and optimize the customer shopping experience by strategically positioning high-demand or promotional items. This tool is especially effective during store layout changes, new product launches, and seasonal promotions to increase sales and reduce stockouts.
Leveraging Heat Mapping for Data-Driven Merchandising
Heat mapping technology captures detailed customer movement and engagement patterns within retail stores, providing granular insights into high-traffic zones and product interaction hotspots. Leveraging these data-driven insights allows retailers to optimize planograms by strategically placing high-demand items and promotional displays in areas with maximum shopper visibility and dwell time. Integrating heat mapping analytics with planogram design enhances merchandising effectiveness, driving sales growth through targeted product placement and improved customer experience.
Integrating Planogram and Heat Mapping Techniques
Integrating planogram and heat mapping techniques enhances retail store layout optimization by combining visual shelf organization with real-time customer movement data. This integration enables retailers to identify high-traffic zones and strategically position products for maximum visibility and sales impact. Leveraging both tools drives data-informed decisions that improve shopper experience and boost overall store performance.
Common Challenges in Planogram and Heat Mapping Implementation
Common challenges in planogram and heat mapping implementation include inaccurate data collection, limited real-time analytics, and inadequate staff training. Both methods often struggle with integrating consumer behavior insights and adapting to dynamic store layouts, reducing their effectiveness in driving sales. Ensuring consistent execution and maintaining updated visual merchandising standards remain critical pain points for retail managers seeking to optimize space and enhance shopper engagement.
Future Trends: Evolving Planogram and Heat Mapping Technologies in Retail
Emerging advancements in artificial intelligence and machine learning are revolutionizing planogram and heat mapping technologies by enabling real-time data analysis and dynamic shelf optimization in retail environments. Integration of augmented reality (AR) and Internet of Things (IoT) devices enhances visualization and customer behavior tracking, providing retailers with deeper insights for more personalized merchandising strategies. The future of retail planograms and heat mapping lies in predictive analytics and automated adjustments, driving greater efficiency in inventory management and improved shopper engagement.
Related Important Terms
Dynamic Planogramming
Dynamic Planogramming integrates real-time data and customer traffic patterns to optimize product placement more effectively than traditional static planograms. Heat mapping technology enhances this process by providing granular insights into shopper behavior, enabling retailers to adjust layouts dynamically and boost sales performance.
Real-time Heat Mapping
Real-time heat mapping in retail provides dynamic visualization of customer movement and product interaction, enabling immediate adjustments to store layouts and merchandising strategies for optimized shopper engagement. Unlike static planograms, heat maps offer actionable insights into traffic patterns and hot spots, driving data-driven decisions that enhance sales performance and inventory placement.
Smart Shelf Analytics
Smart Shelf Analytics integrates planogram compliance with heat mapping to optimize retail shelf performance by accurately tracking product placement and customer interaction patterns. Combining these technologies enhances inventory management and shopper engagement insights, driving sales and operational efficiency.
Visual Merchandising AI
Planogram technology structures product placement using AI-driven visual merchandising insights to enhance shelf organization and optimize space utilization efficiently. Heat mapping analyzes customer movement and focal points in-store, leveraging AI to identify high-traffic zones and improve product visibility, ultimately boosting sales performance.
SKU Velocity Mapping
SKU velocity mapping enhances retail optimization by pinpointing high-turnover products on planograms, enabling precise inventory placement to maximize sales. Heat mapping complements this by visually tracking customer engagement and movement patterns around these SKUs, refining shelf layouts for optimal product exposure.
Consumer Flow Patterning
Planograms strategically position products on shelves based on sales data and consumer preferences, enhancing product visibility and purchase likelihood. Heat mapping analyzes in-store consumer flow patterns by tracking foot traffic and dwell times, identifying high-traffic zones and optimizing store layout to boost shopper engagement and sales.
Interactive Fixture Layouts
Interactive fixture layouts utilize planogram precision to optimize product placement by visualizing shelf space, while heat mapping tracks customer engagement patterns in-store, identifying high-traffic zones for dynamic merchandising adjustments. Combining planograms with heat mapping enhances retail space efficiency, driving sales growth through data-driven, interactive fixture arrangements.
Dwell Time Analytics
Planogram optimizes product placement based on sales data and visual merchandising principles, while heat mapping tracks customer movements and interaction zones to identify high-engagement areas. Dwell time analytics derived from heat mapping provides precise insights into how long shoppers focus on specific displays, enabling retailers to fine-tune layout and increase conversion rates.
RFID-Driven Heat Zones
RFID-driven heat zones enhance traditional planogram strategies by providing real-time, location-specific shopper movement data, allowing retailers to optimize product placement and inventory replenishment with precision. Integrating RFID technology into heat mapping reveals high-traffic areas and shopper dwell times, enabling dynamic adjustments that boost sales and improve store layout effectiveness.
Eye-Tracking Planogram
Eye-tracking planograms leverage heat mapping technology to analyze customer gaze patterns, optimizing product placement for maximum visual engagement and sales conversion. This data-driven approach enhances retail merchandising by identifying high-attention zones and refining shelf layouts based on real-time consumer behavior insights.
Planogram vs Heat mapping Infographic