Planogram designs organize product placement based on strategic layouts to maximize shelf space and improve shopper navigation, while heatmapping analyzes customer behavior by tracking foot traffic and engagement hotspots within the store. Combining planograms with heatmapping data enables retailers to optimize product positioning based on actual consumer interactions, increasing sales potential. This integration enhances inventory management and boosts overall store performance by aligning visual merchandising with customer preferences.
Table of Comparison
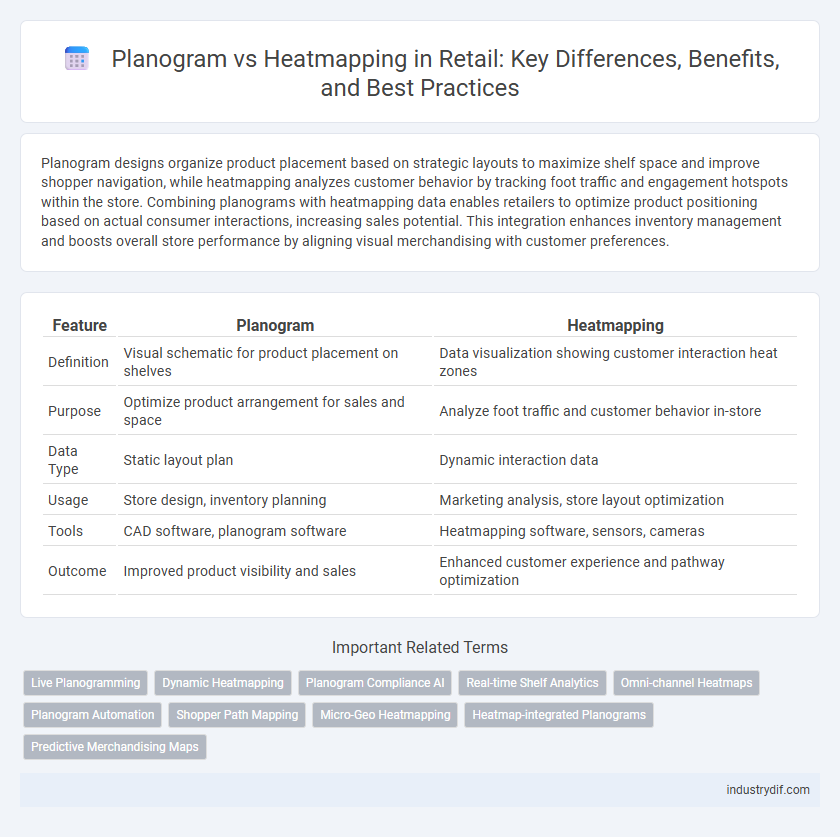
| Feature | Planogram | Heatmapping |
|---|---|---|
| Definition | Visual schematic for product placement on shelves | Data visualization showing customer interaction heat zones |
| Purpose | Optimize product arrangement for sales and space | Analyze foot traffic and customer behavior in-store |
| Data Type | Static layout plan | Dynamic interaction data |
| Usage | Store design, inventory planning | Marketing analysis, store layout optimization |
| Tools | CAD software, planogram software | Heatmapping software, sensors, cameras |
| Outcome | Improved product visibility and sales | Enhanced customer experience and pathway optimization |
Understanding Planograms: Definition and Purpose
Planograms are detailed visual diagrams that specify the placement of products on retail shelves to maximize sales and optimize space utilization. They serve as strategic tools for merchandising, guiding retailers in product arrangement based on consumer behavior, inventory levels, and sales data. Effective planogram implementation improves product visibility, influences purchasing decisions, and enhances overall store performance.
What is Heatmapping in Retail?
Heatmapping in retail is a visual analytics technique that tracks and displays customer interactions within a store, highlighting areas with the highest foot traffic and engagement. Using data from sensors, cameras, or mobile devices, heatmaps reveal shopper behavior patterns, including popular product displays and bottlenecks. Retailers leverage heatmapping insights to optimize store layouts, improve product placement, and enhance the overall shopping experience.
Key Differences Between Planograms and Heatmapping
Planograms are visual merchandising tools that outline the precise placement of products on shelves to maximize sales and optimize store layout, while heatmapping analyzes customer foot traffic and behavior patterns within retail spaces to identify high-engagement zones. Planograms rely on predefined product arrangements based on sales data and category management, whereas heatmapping utilizes real-time data from sensors or video analytics to capture shopper movement and dwell time. The key difference lies in planograms being a prescriptive, design-focused strategy for inventory display, contrasting with heatmapping's descriptive, data-driven approach for understanding customer interactions.
The Role of Data in Planogram and Heatmap Analysis
Data plays a critical role in both planogram and heatmap analysis by providing quantitative insights that drive effective retail space management. Planogram data leverages product placement, sales figures, and inventory levels to optimize shelf layouts and maximize product visibility. Heatmap analysis utilizes customer movement and interaction data within the store to identify high-traffic zones, enabling retailers to refine merchandising strategies and enhance the overall shopping experience.
Benefits of Implementing Planograms in Retail Spaces
Implementing planograms in retail spaces optimizes product placement by analyzing customer traffic patterns and purchase behavior, thereby enhancing shelf space efficiency and increasing sales. Planograms ensure consistent brand presentation and inventory management, reducing stockouts and overstock situations. Leveraging planograms drives higher customer engagement and improves overall store performance compared to relying solely on heatmapping techniques.
Advantages of Using Heatmapping for Retail Optimization
Heatmapping provides detailed visual insights into customer behavior by tracking foot traffic patterns, dwell times, and product engagement within retail spaces. This data-driven approach allows retailers to optimize store layouts, enhance product placement, and improve overall customer experience by identifying high-traffic zones and underperforming areas. Unlike planograms, heatmapping adapts dynamically to real-time consumer interactions, enabling continuous improvement in merchandising strategies.
How Planograms and Heatmapping Work Together
Planograms and heatmapping work together by combining visual merchandising strategies with customer movement data to optimize store layouts and product placement. Planograms provide structured shelf arrangements based on sales data and inventory, while heatmapping tracks shopper behavior and foot traffic patterns. This integration helps retailers enhance product visibility, improve customer experience, and increase sales efficiency by aligning inventory displays with real-time consumer interactions.
Tools and Technologies for Planogram and Heatmap Creation
Planogram creation relies on specialized software such as Blue Yonder, SmartDraw, and Nielsen Spaceman, which utilize 3D modeling and SKU-level data integration to optimize product placement and maximize shelf efficiency. Heatmapping tools like ShopperTrak, Hotjar, and Crazy Egg employ AI-driven analytics and infrared sensors to track consumer movement patterns and dwell times within retail spaces, providing granular insights into shopper behavior. Both technologies leverage cloud computing and big data analytics to enhance decision-making accuracy and drive sales performance through data-driven store layout optimization.
Case Studies: Planogram vs Heatmapping in Real-World Retail
Case studies in retail demonstrate that planograms optimize shelf space by strategically placing products to maximize visibility and sales, while heatmapping analyzes real-time customer movement to identify high-traffic zones and shopper behavior patterns. Retailers implementing planograms reported a 15-20% increase in product turnover due to improved product placement, whereas heatmapping studies revealed critical insights into store layout efficiency and customer engagement areas. Combining planogram data with heatmapping analytics has enabled leading retailers to enhance store design, driving a 10-15% uplift in overall sales and improved customer experience.
Choosing the Right Approach: Planogram, Heatmapping, or Both?
Planograms provide a structured visual representation of product placement based on sales data and customer flow, optimizing shelf space for maximum profitability. Heatmapping captures real-time customer interactions and movement patterns in the store, offering insights into actual consumer behavior and engagement with displays. Combining planogram strategies with heatmapping analytics delivers a comprehensive approach, enhancing merchandising effectiveness and driving improved retail performance.
Related Important Terms
Live Planogramming
Live planogramming integrates real-time data analytics with dynamic retail shelf layouts, enhancing product placement accuracy compared to traditional static planograms. Heatmapping complements this by visually tracking customer interactions and movement patterns, allowing retailers to optimize store layouts for increased engagement and sales.
Dynamic Heatmapping
Dynamic Heatmapping in retail provides real-time, data-driven insights into customer movement and product interactions, enabling retailers to optimize shelf space and product placement beyond static planograms. Unlike traditional planograms, which rely on pre-set layouts, dynamic heatmapping adapts to live consumer behavior patterns, increasing sales potential and enhancing store performance through continuous spatial analysis.
Planogram Compliance AI
Planogram compliance AI leverages machine learning to analyze retail shelf layouts, ensuring products are accurately placed according to predefined plans to maximize sales and inventory management. Heatmapping visualizes customer traffic and engagement patterns but does not directly measure planogram adherence, making planogram compliance AI essential for precise shelf monitoring and real-time corrective action.
Real-time Shelf Analytics
Planogram provides a structured layout framework to optimize product placement based on sales and inventory data, while heatmapping delivers real-time shelf analytics by visually tracking shopper interactions and dwell times to enhance merchandising strategies. Combining planogram compliance with heatmapping insights enables retailers to dynamically adjust inventory and displays, maximizing shelf efficiency and boosting in-store conversion rates.
Omni-channel Heatmaps
Omni-channel heatmaps integrate in-store and online shopper behavior data to optimize product placement and enhance customer experience across all retail touchpoints. Unlike traditional planograms that rely solely on fixed product arrangements, omni-channel heatmaps provide dynamic, real-time insights that drive smarter merchandising strategies and increase sales.
Planogram Automation
Planogram automation leverages AI and machine learning to optimize product placement, enhancing shelf space efficiency and sales performance by automatically adjusting layouts based on sales data and customer behavior. Unlike traditional heatmapping that tracks in-store foot traffic patterns, planogram automation directly influences merchandising strategy through dynamic, data-driven visual schematics.
Shopper Path Mapping
Shopper path mapping tracks customer movement through a retail space to optimize product placement and enhance in-store experience, while planograms visually organize merchandise layout to maximize shelf efficiency. Integrating heatmapping with shopper path data reveals high-traffic zones, enabling retailers to strategically design planograms that drive sales and improve shopper navigation.
Micro-Geo Heatmapping
Micro-Geo Heatmapping in retail provides precise insights into customer movement patterns at a granular, location-specific level, enabling optimized product placement and tailored merchandising strategies far beyond traditional planogram designs. Unlike static planograms, Micro-Geo Heatmapping leverages real-time spatial data to dynamically adjust store layouts, increasing sales conversion rates and enhancing the shopping experience by targeting high-traffic micro zones.
Heatmap-integrated Planograms
Heatmap-integrated planograms enhance retail merchandising by combining visual traffic data with shelf layout optimization, enabling retailers to strategically place high-demand products in high-traffic zones. This integration leverages customer movement patterns and dwell time analytics to improve product visibility, drive sales, and optimize store performance.
Predictive Merchandising Maps
Predictive merchandising maps combine planogram structure with heatmapping analytics to optimize product placement based on shopper behavior and sales data, enhancing retail performance. These tools forecast high-traffic zones and recommend strategic product assortments to maximize revenue and improve customer engagement.
Planogram vs Heatmapping Infographic