Logging captures detailed records of system events for troubleshooting specific issues, while observability provides a comprehensive, real-time insight into the entire system's health using metrics, logs, and traces. Observability enables proactive detection and diagnosis of complex problems by correlating data sources to understand system behavior beyond isolated logs. Effective monitoring relies on combining both logging and observability to ensure robust performance analysis and faster incident resolution.
Table of Comparison
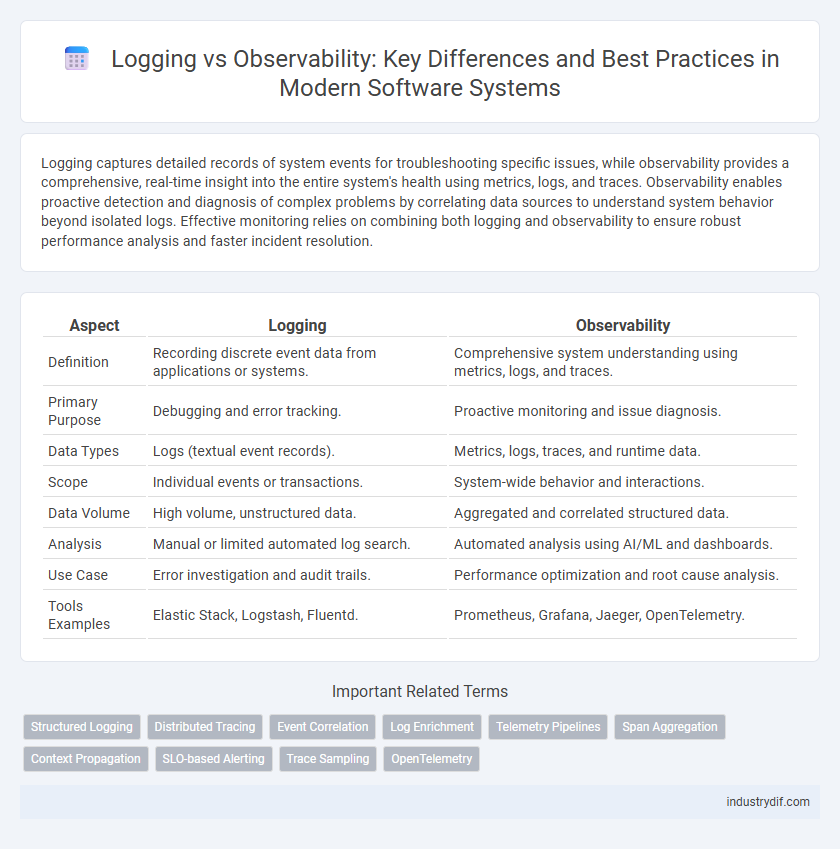
| Aspect | Logging | Observability |
|---|---|---|
| Definition | Recording discrete event data from applications or systems. | Comprehensive system understanding using metrics, logs, and traces. |
| Primary Purpose | Debugging and error tracking. | Proactive monitoring and issue diagnosis. |
| Data Types | Logs (textual event records). | Metrics, logs, traces, and runtime data. |
| Scope | Individual events or transactions. | System-wide behavior and interactions. |
| Data Volume | High volume, unstructured data. | Aggregated and correlated structured data. |
| Analysis | Manual or limited automated log search. | Automated analysis using AI/ML and dashboards. |
| Use Case | Error investigation and audit trails. | Performance optimization and root cause analysis. |
| Tools Examples | Elastic Stack, Logstash, Fluentd. | Prometheus, Grafana, Jaeger, OpenTelemetry. |
Introduction to Logging and Observability
Logging captures discrete events and records system activities with timestamps, providing a foundational method for troubleshooting and performance analysis. Observability extends beyond logging by integrating metrics, traces, and logs to offer a comprehensive, real-time view of system health and behavior. Combining these approaches enhances the ability to detect, diagnose, and resolve complex technical issues efficiently.
Key Differences Between Logging and Observability
Logging captures discrete event data, providing a timestamped record of system activities to aid in troubleshooting. Observability encompasses logging, metrics, and traces, offering a holistic view of system health and performance. Unlike logging, observability enables proactive detection and diagnosis of complex issues through correlated data analysis.
Core Components of Logging
Logging captures discrete events and records system activities through log files, timestamps, and severity levels. Core components include log generation, collection, storage, and analysis, enabling effective troubleshooting and auditing. Structured logging formats enhance query efficiency and integration with monitoring tools for improved system visibility.
Essential Elements of Observability
Observability encompasses three essential elements: metrics, logs, and traces, which collectively provide comprehensive insights into system behavior. Metrics offer quantitative data on system performance, logs capture detailed event records, and traces map the flow of requests across distributed components. These elements enable proactive detection, diagnosis, and resolution of issues beyond traditional logging capabilities.
Log Management Best Practices
Effective log management best practices include centralized log aggregation to streamline data analysis and incident response. Implement structured logging with consistent formatting and metadata to enhance searchability and correlation across distributed systems. Regular log retention policies and secure storage ensure compliance and data integrity while optimizing storage costs.
Observability Pillars: Metrics, Traces, and Logs
Observability encompasses three critical pillars: metrics, traces, and logs, each providing unique insights into system performance and behavior. Metrics offer quantitative data to monitor system health and detect anomalies, traces reveal the flow of requests across distributed services for root cause analysis, and logs capture detailed event information to diagnose issues precisely. Unlike traditional logging, observability integrates these pillars to deliver comprehensive, real-time visibility into complex architectures.
When to Use Logging vs Observability
Logging is essential for capturing detailed, timestamped records of system events and errors, making it ideal for debugging specific issues and tracing application execution paths. Observability encompasses metrics, traces, and logs to provide a comprehensive understanding of system behavior, enabling proactive monitoring, anomaly detection, and root cause analysis in complex, distributed environments. Use logging for granular, event-level insights during development and troubleshooting, while leveraging observability tools for real-time performance monitoring and maintaining system reliability at scale.
Challenges in Implementing Logging and Observability
Implementing logging and observability faces challenges such as managing the massive volume of data generated by distributed systems, which can overwhelm storage and processing capabilities. Ensuring consistency and accuracy of logs across diverse microservices requires robust instrumentation and standardized formats, complicating integration efforts. Additionally, extracting actionable insights from raw data demands advanced analytics tools and skilled personnel, often increasing operational costs and complexity.
Selecting Tools for Logging and Observability
Selecting tools for logging and observability requires evaluating scalability, integration capabilities, and real-time data processing features. Effective logging tools such as ELK Stack and Fluentd excel in centralized log aggregation and search optimization, while observability platforms like Datadog and New Relic provide comprehensive metrics, traces, and alerting. Prioritizing tools that support customizable dashboards, anomaly detection, and seamless cloud-native environment compatibility enhances proactive system monitoring and troubleshooting.
Future Trends in Logging and Observability
Future trends in logging and observability emphasize increased automation through AI-driven analytics and anomaly detection, enabling proactive system monitoring and faster root cause analysis. Distributed tracing and real-time metrics integration are evolving to provide deeper insights into complex microservices architectures, improving performance optimization and fault tolerance. Cloud-native observability platforms with enhanced scalability and unified data pipelines are becoming essential to handle the growing volume and diversity of telemetry data in modern infrastructures.
Related Important Terms
Structured Logging
Structured logging captures machine-readable, context-rich event data enabling efficient querying and analysis, which is crucial for enhancing observability in complex distributed systems. Unlike traditional logging, structured logs facilitate real-time monitoring, root cause analysis, and automated alerting by integrating seamlessly with observability tools and platforms.
Distributed Tracing
Distributed tracing captures detailed, end-to-end transaction paths across microservices, providing granular visibility that logging alone cannot achieve in complex, distributed systems. It enables correlation of events and latency analysis, making root cause identification faster and more precise compared to isolated log entries.
Event Correlation
Event correlation in logging involves aggregating and linking discrete log entries to identify patterns or anomalies, whereas observability extends beyond logs to encompass metrics and traces, enabling comprehensive event correlation across distributed systems for faster root cause analysis and proactive issue detection. Advanced observability platforms leverage event correlation to connect telemetry data from multiple sources, providing actionable insights and reducing mean time to resolution (MTTR) compared to traditional logging methods.
Log Enrichment
Log enrichment enhances observability by adding contextual metadata such as user IDs, transaction IDs, and service names to raw log entries, enabling faster root cause analysis and improved correlation across distributed systems. This semantic augmentation transforms logs into actionable insights, reducing mean time to detect (MTTD) and mean time to resolve (MTTR) issues in complex microservices architectures.
Telemetry Pipelines
Logging captures discrete event data essential for tracing system operations, while observability integrates metrics, traces, and logs through telemetry pipelines to provide holistic real-time insights into system performance and health. Telemetry pipelines enable efficient collection, processing, and enrichment of diverse data streams, facilitating faster anomaly detection and root cause analysis in complex distributed systems.
Span Aggregation
Span aggregation consolidates multiple tracing spans into a unified representation, enabling efficient performance analysis and root cause identification in distributed systems. Unlike traditional logging, which records discrete events, aggregated spans provide a holistic view of system behavior by correlating related operations across services.
Context Propagation
Context propagation enables seamless correlation of distributed logs and traces, enhancing the depth of observability by maintaining trace identifiers across service boundaries. Unlike traditional logging, which captures isolated events, context propagation integrates logs with metrics and traces, providing a comprehensive view for root cause analysis in complex systems.
SLO-based Alerting
Logging captures discrete events and error messages, while observability leverages metrics, traces, and logs to provide comprehensive system insights; SLO-based alerting uses predefined service level objectives to trigger alerts only when actual performance deviates from targets, reducing noise and improving incident response efficiency. This approach aligns alerts with user experience, enabling proactive detection and resolution of issues before they impact service reliability.
Trace Sampling
Trace sampling selectively captures trace data to reduce storage and processing overhead, essential for managing high-volume distributed systems. Effective sampling strategies enhance observability by ensuring critical traces are retained while minimizing noise from less relevant logs.
OpenTelemetry
OpenTelemetry provides a unified framework for observability by collecting logs, metrics, and traces, enabling comprehensive monitoring beyond traditional logging systems that focus solely on event recording. It enhances system diagnostics and performance analysis through standardized data instrumentation and contextual correlation across distributed applications.
Logging vs Observability Infographic