System monitoring involves tracking predefined metrics and logs to ensure a system's health and performance, offering insight into resource usage and error rates. Observability extends beyond monitoring by enabling the understanding of a system's internal state through analyzing distributed traces, logs, and metrics in real-time. This approach provides a comprehensive view for diagnosing complex issues and improving system reliability.
Table of Comparison
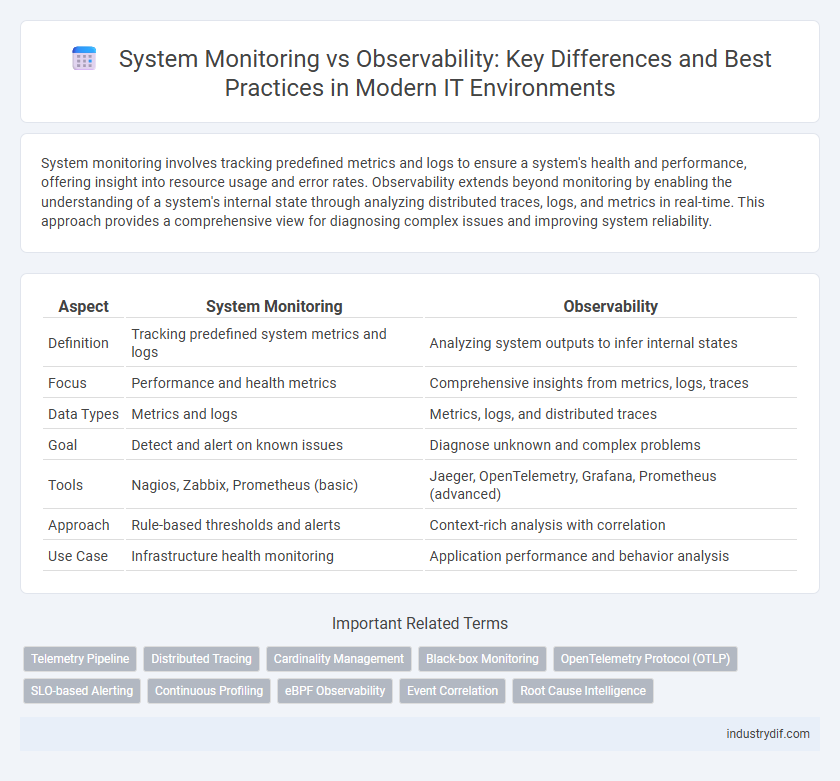
| Aspect | System Monitoring | Observability |
|---|---|---|
| Definition | Tracking predefined system metrics and logs | Analyzing system outputs to infer internal states |
| Focus | Performance and health metrics | Comprehensive insights from metrics, logs, traces |
| Data Types | Metrics and logs | Metrics, logs, and distributed traces |
| Goal | Detect and alert on known issues | Diagnose unknown and complex problems |
| Tools | Nagios, Zabbix, Prometheus (basic) | Jaeger, OpenTelemetry, Grafana, Prometheus (advanced) |
| Approach | Rule-based thresholds and alerts | Context-rich analysis with correlation |
| Use Case | Infrastructure health monitoring | Application performance and behavior analysis |
Defining System Monitoring and Observability
System monitoring involves collecting predefined metrics and logs to track system performance and detect known issues through alerting mechanisms. Observability extends beyond monitoring by enabling deep insights into complex system behaviors using distributed tracing, log aggregation, and real-time analytics to understand and diagnose unknown problems. This distinction emphasizes monitoring as reactive and observability as proactive in maintaining system reliability and performance.
Core Objectives: Monitoring vs Observability
System monitoring focuses on tracking predefined metrics and alerts to detect and respond to specific issues within an infrastructure, emphasizing real-time status and performance thresholds. Observability encompasses monitoring but extends to analyzing logs, traces, and metrics to provide deeper insights into system behavior and root causes, enabling proactive problem-solving and optimization. Core objectives of monitoring center on issue detection, while observability aims to understand internal state and system dynamics through comprehensive data correlation and analysis.
Key Components of System Monitoring
System Monitoring primarily involves the continuous collection and analysis of metrics, logs, and alerts to track the health and performance of hardware and software systems. Key components include real-time data gathering tools, threshold-based alerting mechanisms, and dashboard visualization for immediate issue detection. These elements enable rapid identification of system anomalies, ensuring operational stability and minimizing downtime.
Pillars of Observability
System monitoring primarily focuses on tracking predefined metrics and logs to detect and alert on known issues, whereas observability provides a deeper understanding of system behavior through three pillars: metrics, logs, and traces. Metrics quantify system performance and resource usage, logs offer detailed, contextual information about events, and traces follow requests through distributed systems to diagnose complex failures. Together, these pillars enable proactive identification of unknown problems and facilitate root cause analysis in modern, dynamic environments.
Data Collection: Metrics, Logs, and Traces
System monitoring primarily relies on collecting metrics and logs to provide visibility into system performance and health by measuring resource usage and recording events. Observability expands this approach by integrating traces alongside metrics and logs, enabling a detailed understanding of system behavior and root cause analysis through distributed tracing. Combining these data types supports proactive issue detection and comprehensive troubleshooting in complex, modern architectures.
Alerting and Incident Response
System monitoring relies on predefined alerts based on threshold breaches to detect issues, often leading to reactive incident response. Observability enhances alerting by leveraging context-rich telemetry data such as logs, metrics, and traces, enabling proactive anomaly detection and faster root cause analysis. This comprehensive visibility supports more efficient incident response workflows by providing actionable insights and reducing mean time to resolution (MTTR).
Depth of Insights: Symptoms vs Root Cause Analysis
System monitoring primarily captures symptoms by tracking predefined metrics and alerts, offering surface-level insights into system performance and failures. Observability provides deeper insights through comprehensive data collection, including logs, traces, and metrics, enabling root cause analysis and proactive issue detection. This depth of insight allows engineers to understand system behavior holistically and resolve underlying problems more effectively.
Tooling: Monitoring and Observability Platforms
Monitoring platforms primarily focus on collecting and visualizing metrics, logs, and alerts to track system health and detect issues. Observability platforms extend this by integrating tracing, correlation, and AI-driven analytics, enabling deeper insights into system behavior and root cause analysis. Leading tools like Prometheus and Nagios excel in monitoring, while platforms such as Datadog, New Relic, and Honeycomb offer comprehensive observability capabilities for complex, distributed architectures.
Deployment Strategies in Modern Architectures
Deployment strategies in modern architectures prioritize observability to enhance system monitoring by integrating telemetry data collection directly into distributed services and containerized environments. Observability focuses on deploying instrumentation frameworks like OpenTelemetry alongside microservices, enabling real-time insights through metrics, logs, and traces, surpassing traditional polling-based monitoring methods. This proactive deployment approach supports dynamic scaling, event-driven applications, and continuous delivery pipelines, ensuring robust performance and rapid anomaly detection in cloud-native infrastructures.
Future Trends in System Monitoring and Observability
Future trends in system monitoring and observability emphasize the integration of AI-driven analytics and machine learning to predict and prevent system failures proactively. The adoption of distributed tracing and real-time telemetry data collection enhances visibility across complex, multi-cloud environments, enabling more precise root cause analysis. Advances in automation and adaptive algorithms will continuously optimize alerting mechanisms, reducing noise and improving operational efficiency.
Related Important Terms
Telemetry Pipeline
A telemetry pipeline in system monitoring collects metrics, logs, and traces to provide real-time data for performance tracking and issue detection. Observability leverages this telemetry pipeline to enable deeper insights through correlation and analysis, facilitating proactive system health management and troubleshooting.
Distributed Tracing
Distributed tracing enhances observability by providing detailed insights into request flows across microservices, enabling pinpointing of latency and failure points within complex systems. Unlike traditional system monitoring, which relies on metrics and logs, distributed tracing captures the end-to-end context of transactions, facilitating faster root cause analysis in distributed architectures.
Cardinality Management
System monitoring provides metrics, logs, and alerts focused on predefined performance indicators, while observability emphasizes exploring high-cardinality data to identify complex system behaviors and anomalies effectively. Cardinality management in observability involves controlling the volume and diversity of unique metric labels to optimize storage, query performance, and actionable insights.
Black-box Monitoring
Black-box monitoring captures system metrics and performance data without requiring access to internal code or infrastructure, enabling real-time detection of outages and anomalies from an external viewpoint. This approach complements observability by providing a high-level overview of system health, but lacks the granular trace and log data necessary for deep root cause analysis.
OpenTelemetry Protocol (OTLP)
System monitoring primarily collects predefined metrics and logs to track performance and detect anomalies, whereas observability leverages OpenTelemetry Protocol (OTLP) to unify traces, metrics, and logs for comprehensive insights into complex system behaviors. OTLP enables standardized data instrumentation across distributed systems, improving root cause analysis and enhancing real-time monitoring with seamless integration and interoperability.
SLO-based Alerting
SLO-based alerting in system monitoring prioritizes predefined service level objectives to trigger notifications when performance metrics deviate from targets, ensuring timely response to maintain reliability. Observability enhances this by providing deeper insights through distributed tracing, logs, and metrics, enabling root cause analysis beyond mere threshold breaches for proactive issue resolution.
Continuous Profiling
Continuous profiling enables system monitoring by collecting real-time performance data, while observability leverages this data to provide deep insights into system behavior and root cause analysis. Integrating continuous profiling with observability platforms enhances anomaly detection and optimizes resource allocation across distributed systems.
eBPF Observability
eBPF observability leverages extended Berkeley Packet Filter technology to provide deep, real-time insights into kernel and application behavior without modifying code, enabling precise system monitoring and troubleshooting. Unlike traditional system monitoring, eBPF-driven observability offers granular visibility into performance metrics, security events, and network activity with minimal overhead.
Event Correlation
System monitoring collects and analyzes predefined metrics and logs, providing a snapshot of system health, while observability leverages event correlation across diverse telemetry data--logs, traces, and metrics--to uncover underlying issues dynamically. Event correlation enhances observability by mapping interdependencies and detecting anomalous patterns, enabling proactive incident detection and faster root cause analysis in complex distributed systems.
Root Cause Intelligence
System monitoring collects and analyzes predefined metrics and logs to identify anomalies and performance issues, while observability leverages distributed tracing, event correlation, and contextual data to provide deep root cause intelligence, enabling faster diagnostics and resolution. Root cause intelligence in observability integrates real-time telemetry with machine learning algorithms to automatically pinpoint underlying failures across complex, dynamic systems.
System Monitoring vs Observability Infographic