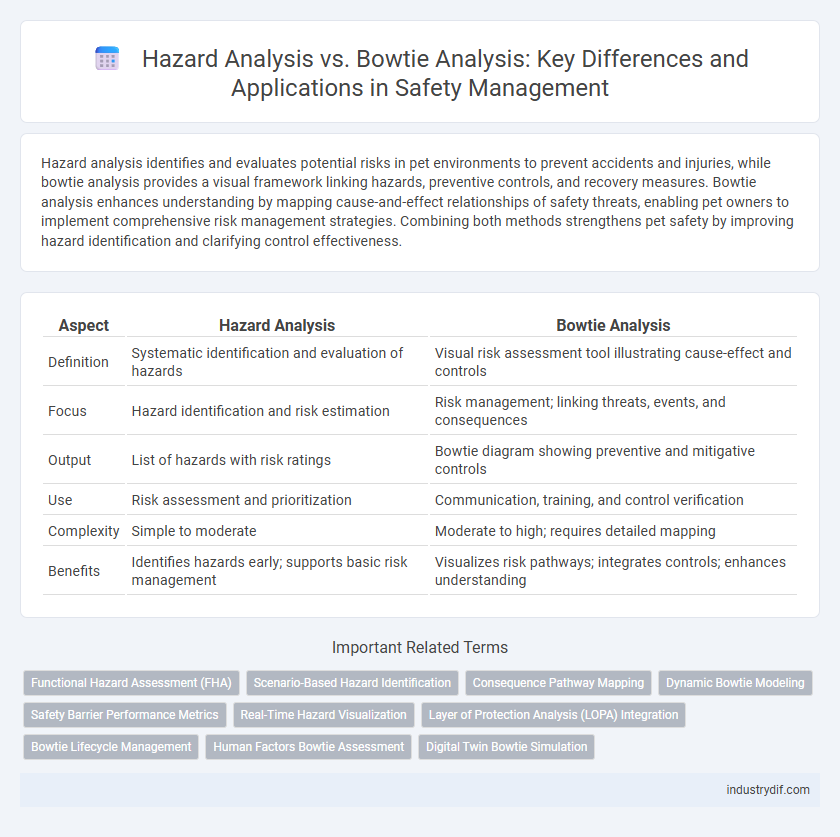
Hazard analysis identifies and evaluates potential risks in pet environments to prevent accidents and injuries, while bowtie analysis provides a visual framework linking hazards, preventive controls, and recovery measures. Bowtie analysis enhances understanding by mapping cause-and-effect relationships of safety threats, enabling pet owners to implement comprehensive risk management strategies. Combining both methods strengthens pet safety by improving hazard identification and clarifying control effectiveness.
Table of Comparison
| Aspect | Hazard Analysis | Bowtie Analysis |
|---|---|---|
| Definition | Systematic identification and evaluation of hazards | Visual risk assessment tool illustrating cause-effect and controls |
| Focus | Hazard identification and risk estimation | Risk management; linking threats, events, and consequences |
| Output | List of hazards with risk ratings | Bowtie diagram showing preventive and mitigative controls |
| Use | Risk assessment and prioritization | Communication, training, and control verification |
| Complexity | Simple to moderate | Moderate to high; requires detailed mapping |
| Benefits | Identifies hazards early; supports basic risk management | Visualizes risk pathways; integrates controls; enhances understanding |
Understanding Hazard Analysis: Key Concepts
Hazard analysis identifies potential sources of harm by systematically examining processes, equipment, and environments to prevent accidents before they occur. It involves techniques such as Failure Mode and Effects Analysis (FMEA) and Hazard and Operability Study (HAZOP) to evaluate risk severity and likelihood. Understanding these key concepts enables organizations to implement targeted controls and ensure compliance with safety regulations.
What is Bowtie Analysis? An Overview
Bowtie Analysis is a risk management tool that visually maps out potential hazards, causes, and consequences to prevent accidents and improve safety. It combines elements of fault tree analysis and event tree analysis, creating a "bowtie" shape that illustrates both preventive controls and mitigation measures. This method enhances hazard identification and control effectiveness by providing a clear overview of risk pathways and barriers in complex systems.
Core Differences Between Hazard Analysis and Bowtie Analysis
Hazard Analysis identifies and evaluates potential risks and hazards by systematically examining processes to prevent accidents, focusing on hazard recognition, risk estimation, and control measures. Bowtie Analysis visually represents the relationship between hazards, their causes, preventive controls, and consequences using a diagram that integrates fault trees and event trees. Core differences lie in Hazard Analysis being primarily qualitative or quantitative risk assessment, while Bowtie Analysis combines risk assessment with a clear graphical depiction of barriers and fault paths, enhancing communication and risk management.
Applications of Hazard Analysis in Safety Management
Hazard analysis plays a critical role in safety management by systematically identifying potential risks and evaluating their impact to prevent accidents and enhance workplace safety. In industries such as chemical processing, construction, and manufacturing, hazard analysis informs the development of safety protocols, emergency response plans, and risk mitigation strategies. Compared to bowtie analysis, which visualizes risk pathways and controls, hazard analysis focuses on comprehensive risk identification and prioritization to guide safety decision-making.
Bowtie Analysis: Structure and Methodology
Bowtie Analysis employs a visual diagram that centers on a critical hazard, illustrating both the potential causes (threats) on the left and the possible consequences on the right, connected by a core event at the center. This method integrates preventive barriers on the left side to stop hazards from escalating and mitigative controls on the right side to reduce the impact of adverse outcomes. Its structured approach facilitates clear communication, risk identification, and management by visually linking causes, controls, and consequences in a single, coherent framework.
Advantages of Using Hazard Analysis
Hazard analysis offers a systematic approach to identifying potential risks and their sources, enabling targeted risk mitigation strategies. It provides detailed insight into specific hazards, facilitating compliance with regulatory standards and improving workplace safety protocols. This method supports continuous monitoring and early detection of emerging threats, reducing the likelihood of accidents.
Benefits of Implementing Bowtie Analysis
Bowtie Analysis provides a comprehensive visualization of risk pathways by linking potential hazards to preventive and mitigative controls, enhancing hazard communication and understanding. It simplifies complex risk scenarios into a clear, graphical format, improving stakeholder engagement and decision-making. Implementing Bowtie Analysis supports proactive safety management by identifying critical control points and monitoring their effectiveness, reducing the likelihood and impact of hazardous events.
Integration of Hazard Analysis and Bowtie Analysis
Integrating hazard analysis with Bowtie analysis enhances risk management by combining systematic hazard identification with visual representation of controls and barriers. This integration enables organizations to clearly map out potential causes and consequences of hazards while illustrating preventive and mitigative measures in a single framework. The combined approach improves decision-making, supports compliance, and strengthens safety performance through comprehensive risk assessment and communication.
Common Challenges in Hazard and Bowtie Analyses
Hazard analysis and Bowtie analysis both face challenges in accurately identifying all potential risks due to incomplete data and subjective judgment in risk assessment. Ensuring comprehensive threat identification and control measure validation often requires integrating cross-disciplinary expertise and consistent updates as operational conditions change. Both methods struggle with maintaining clarity when complex systems involve multiple overlapping hazards and controls, increasing the risk of oversight in safety planning.
Best Practices for Effective Safety Risk Analysis
Hazard Analysis identifies potential sources of harm by systematically evaluating equipment, processes, and environments, enabling the implementation of targeted risk controls. Bowtie Analysis visually maps the pathways from hazards to potential consequences, integrating preventive and mitigative barriers to enhance risk communication and management. Combining both methods leverages comprehensive hazard identification with clear risk visualization, improving decision-making and fostering a proactive safety culture in complex operational settings.
Related Important Terms
Functional Hazard Assessment (FHA)
Functional Hazard Assessment (FHA) systematically identifies potential hazards and evaluates their impact on system functions, serving as a foundational step in both Hazard Analysis and Bowtie Analysis frameworks. While Hazard Analysis provides a broad identification of risks, Bowtie Analysis visually maps cause-and-effect relationships, enhancing understanding of preventive and mitigative controls for hazards identified through FHA.
Scenario-Based Hazard Identification
Scenario-based hazard identification in Bowtie Analysis provides a structured visual representation of risks, linking causes, preventive barriers, and consequences, which enhances clarity over traditional hazard analysis methods that often list hazards without connecting scenarios. This approach improves risk communication and control measure effectiveness by mapping potential incident pathways and preventive strategies within complex operational environments.
Consequence Pathway Mapping
Hazard Analysis identifies potential risks by systematically examining hazards and their causes, while Bowtie Analysis visualizes the consequence pathways by mapping the central hazard, preventive controls, and mitigation measures in a single diagram. Consequence pathway mapping in Bowtie Analysis enhances safety management by clearly illustrating how hazards lead to events and the barriers that prevent or mitigate adverse outcomes.
Dynamic Bowtie Modeling
Hazard Analysis systematically identifies and evaluates potential risks, while Bowtie Analysis visually maps hazards with preventive and mitigative controls; Dynamic Bowtie Modeling enhances this by incorporating real-time data and evolving scenarios to improve decision-making and safety performance. Integrating live input allows Dynamic Bowtie to adapt risk controls dynamically, increasing situational awareness and reducing incident likelihood more effectively than static hazard assessments.
Safety Barrier Performance Metrics
Hazard Analysis identifies potential risks and their causes, focusing on preventing incidents by assessing hazard likelihood and severity, whereas Bowtie Analysis visually maps out safety barriers and evaluates their effectiveness in controlling hazards. Safety Barrier Performance Metrics in Bowtie Analysis specifically measure the reliability, availability, and integrity of each barrier, providing actionable insights to improve risk controls and enhance overall safety management.
Real-Time Hazard Visualization
Hazard Analysis traditionally identifies potential risks through systematic evaluation, while Bowtie Analysis visually maps hazard pathways, controls, and consequences in real-time, enhancing dynamic risk assessment. Real-time hazard visualization in Bowtie Analysis allows safety teams to monitor control effectiveness and respond swiftly to emerging threats, improving overall hazard management and incident prevention.
Layer of Protection Analysis (LOPA) Integration
Hazard Analysis identifies potential risks and failure points, while Bowtie Analysis visually maps hazards, preventive barriers, and mitigation measures to assess risk pathways. Integrating Layer of Protection Analysis (LOPA) within Bowtie Analysis quantifies the effectiveness of each protective layer, enhancing decision-making on risk reduction strategies and resource allocation.
Bowtie Lifecycle Management
Bowtie Lifecycle Management enhances hazard analysis by providing a dynamic framework that visualizes risk pathways and control measures throughout an asset's operational life. This approach integrates real-time monitoring, periodic reviews, and continuous improvement, ensuring that safety barriers remain effective against evolving hazards.
Human Factors Bowtie Assessment
Hazard Analysis identifies potential risks and hazards in a system, while Bowtie Analysis visually maps out preventive and mitigative controls around a central hazard, emphasizing pathways from causes to consequences; Human Factors Bowtie Assessment integrates human error probabilities and behavioral conditions to enhance understanding of how human actions influence safety barriers and incident outcomes. This approach enables targeted interventions on system design, training, and organizational culture to reduce human error and improve overall safety performance.
Digital Twin Bowtie Simulation
Hazard Analysis identifies potential risks and their causes, while Bowtie Analysis visually maps threats, preventive barriers, and consequences in a structured format. Digital Twin Bowtie Simulation enhances this by creating a dynamic, real-time virtual model of the system, enabling continuous monitoring, predictive risk assessment, and optimized safety barrier management.
Hazard Analysis vs Bowtie Analysis Infographic