Financial statements provide a comprehensive historical overview of a company's financial performance and position, typically generated quarterly or annually. Real-time financial dashboards offer dynamic, up-to-the-minute data visualization, enabling immediate analysis and decision-making. Combining both tools enhances financial accuracy, strategic planning, and responsiveness to market changes.
Table of Comparison
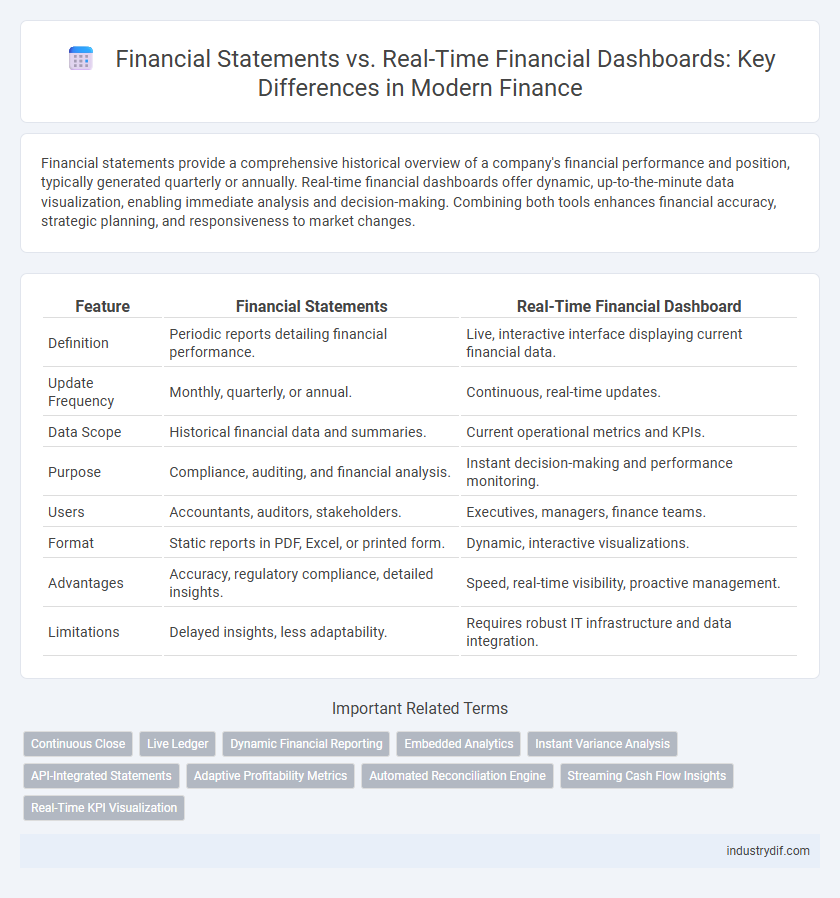
| Feature | Financial Statements | Real-Time Financial Dashboard |
|---|---|---|
| Definition | Periodic reports detailing financial performance. | Live, interactive interface displaying current financial data. |
| Update Frequency | Monthly, quarterly, or annual. | Continuous, real-time updates. |
| Data Scope | Historical financial data and summaries. | Current operational metrics and KPIs. |
| Purpose | Compliance, auditing, and financial analysis. | Instant decision-making and performance monitoring. |
| Users | Accountants, auditors, stakeholders. | Executives, managers, finance teams. |
| Format | Static reports in PDF, Excel, or printed form. | Dynamic, interactive visualizations. |
| Advantages | Accuracy, regulatory compliance, detailed insights. | Speed, real-time visibility, proactive management. |
| Limitations | Delayed insights, less adaptability. | Requires robust IT infrastructure and data integration. |
Understanding Financial Statements in Finance
Financial statements provide a comprehensive snapshot of a company's financial health through standardized reports such as the balance sheet, income statement, and cash flow statement. These documents offer detailed historical data essential for assessing profitability, liquidity, and solvency over a specific period. Understanding financial statements is crucial for accurate financial analysis, regulatory compliance, and strategic decision-making in finance.
What is a Real-Time Financial Dashboard?
A real-time financial dashboard is an interactive platform that displays up-to-the-minute financial data, enabling businesses to monitor key performance indicators such as cash flow, revenue, and expenses instantly. Unlike traditional financial statements, which provide historical data compiled periodically, real-time dashboards integrate live data feeds from accounting systems and other financial software to offer dynamic insights. This immediate access to current financial metrics supports faster decision-making and proactive financial management.
Key Components of Financial Statements
Financial statements consist of the balance sheet, income statement, cash flow statement, and statement of shareholders' equity, each providing critical financial data such as assets, liabilities, revenues, expenses, and equity changes. These standardized reports offer a historical, comprehensive overview crucial for regulatory compliance, auditing, and strategic decision-making. Real-time financial dashboards complement financial statements by delivering dynamic, up-to-date metrics but cannot replace the detailed and structured insights found in traditional financial statements.
Core Features of Real-Time Financial Dashboards
Real-time financial dashboards provide dynamic data visualization, enabling instantaneous tracking of key performance indicators such as cash flow, revenue, and expenses. They integrate automated data aggregation from multiple sources, ensuring up-to-date accuracy and allowing for proactive financial decision-making. Interactive drill-down capabilities enhance granular analysis, offering deeper insights compared to the static nature of traditional financial statements.
Comparative Analysis: Financial Statements vs Real-Time Dashboards
Financial statements provide comprehensive historical data, including balance sheets, income statements, and cash flow statements essential for regulatory compliance and long-term trend analysis. Real-time financial dashboards offer dynamic, up-to-the-minute insights leveraging live data feeds, enabling immediate decision-making and operational agility. The comparative advantage lies in financial statements' accuracy and completeness for formal reporting versus real-time dashboards' speed and interactivity for proactive financial management.
Benefits of Financial Statements for Businesses
Financial statements provide a comprehensive snapshot of a company's financial health, including balance sheets, income statements, and cash flow statements, which are essential for long-term strategic planning and regulatory compliance. These documents offer verified historical data, enabling businesses to perform accurate financial analysis, assess profitability, and track fiscal performance over reporting periods. Financial statements are crucial for securing financing, investors, and facilitating tax reporting due to their standardized and audited nature.
Advantages of Real-Time Financial Dashboards
Real-time financial dashboards provide immediate access to up-to-date financial metrics, enabling quicker decision-making compared to traditional financial statements, which are often historical and retrospective. These dashboards integrate data from multiple sources, offering comprehensive visualization and trend analysis that enhance forecasting accuracy and operational agility. By delivering dynamic insights, real-time dashboards improve cash flow management and risk assessment, empowering finance teams to respond proactively to market changes.
Limitations of Traditional Financial Statements
Traditional financial statements provide a historical snapshot of an organization's financial health, often lagging behind current market conditions and failing to capture real-time financial dynamics. These static reports lack the granularity and immediacy required for proactive decision-making in rapidly changing environments. Consequently, reliance on traditional statements can delay identification of financial risks and opportunities compared to real-time financial dashboards.
Use Cases: When to Use Financial Statements vs Real-Time Dashboards
Financial statements provide comprehensive historical data ideal for auditing, regulatory compliance, and long-term financial analysis, essential during quarterly or annual reporting periods. Real-time financial dashboards deliver up-to-the-minute insights into cash flow, expenses, and revenue trends, supporting immediate decision-making and operational adjustments. Organizations leverage financial statements for strategic planning and external reporting, while dashboards enhance daily management and prompt response to financial anomalies.
Future Trends in Financial Reporting and Dashboard Integration
Financial statements increasingly incorporate real-time financial dashboards to enhance dynamic decision-making and predictive analytics. Future trends highlight seamless integration of AI-driven insights and blockchain verification within financial reporting, ensuring accuracy, transparency, and immediacy. Enhanced dashboard technology enables CFOs and financial analysts to monitor KPIs live, facilitating agile financial strategy adjustments aligned with evolving market conditions.
Related Important Terms
Continuous Close
Financial statements provide standardized, periodic snapshots of a company's financial health, whereas real-time financial dashboards enable continuous close processes by delivering instant visibility into transactions and balances, facilitating more agile decision-making. Continuous close reduces the time lag between transaction occurrences and reporting, improving accuracy and accelerating financial insights for strategic management.
Live Ledger
Financial statements provide a historical overview of a company's financial performance through periodic reports, while a real-time financial dashboard with a live ledger offers instantaneous updates on transactions and balances, enabling more dynamic decision-making. This live ledger integration enhances accuracy by reflecting current financial positions, streamlining cash flow management and improving operational transparency.
Dynamic Financial Reporting
Financial statements provide static, historical financial data often updated quarterly or annually, whereas real-time financial dashboards offer dynamic financial reporting by continuously aggregating and visualizing up-to-the-minute financial metrics. Dynamic financial dashboards enable immediate decision-making through interactive charts, KPIs, and trend analysis, enhancing transparency and operational agility across financial management.
Embedded Analytics
Embedded analytics in financial statements enables detailed historical data analysis, while real-time financial dashboards provide instantaneous insights for dynamic decision-making. Integrating embedded analytics into dashboards enhances visibility into key performance indicators, streamlining financial reporting and forecasting accuracy.
Instant Variance Analysis
Financial statements provide historical financial data essential for comprehensive analysis, whereas real-time financial dashboards enable instant variance analysis by continuously updating key performance indicators and highlighting deviations as they occur. This immediate visibility into financial discrepancies allows for quicker decision-making and proactive management of cash flow, expenses, and revenue trends.
API-Integrated Statements
API-integrated financial statements enable seamless data synchronization between accounting systems and real-time financial dashboards, enhancing accuracy and immediacy in financial reporting. This integration allows businesses to monitor key financial metrics continuously, supporting more informed decision-making through up-to-date insights.
Adaptive Profitability Metrics
Financial statements provide historical profitability metrics based on standardized accounting periods, while real-time financial dashboards offer adaptive profitability metrics that update continuously to reflect current business conditions. Adaptive profitability metrics integrate dynamic data streams, enabling more granular and timely analysis for strategic decision-making and operational agility.
Automated Reconciliation Engine
Financial statements provide summarized historical financial data, while a real-time financial dashboard equipped with an automated reconciliation engine offers immediate, continuous validation by cross-referencing transactions and account balances to ensure accuracy and detect discrepancies instantly. This automation reduces manual errors, accelerates financial close processes, and enhances decision-making through up-to-the-minute financial insights.
Streaming Cash Flow Insights
Financial statements provide historical snapshots of a company's financial performance, while real-time financial dashboards deliver continuous streaming cash flow insights that enable immediate decision-making. These dashboards aggregate and visualize up-to-the-minute transaction data, enhancing liquidity management and forecasting accuracy.
Real-Time KPI Visualization
Real-time financial dashboards provide instantaneous KPI visualization, enabling dynamic monitoring of liquidity ratios, profit margins, and cash flow metrics to support agile decision-making. Unlike traditional financial statements, these dashboards integrate live data feeds, enhancing accuracy and responsiveness in financial performance analysis.
Financial Statements vs Real-Time Financial Dashboard Infographic